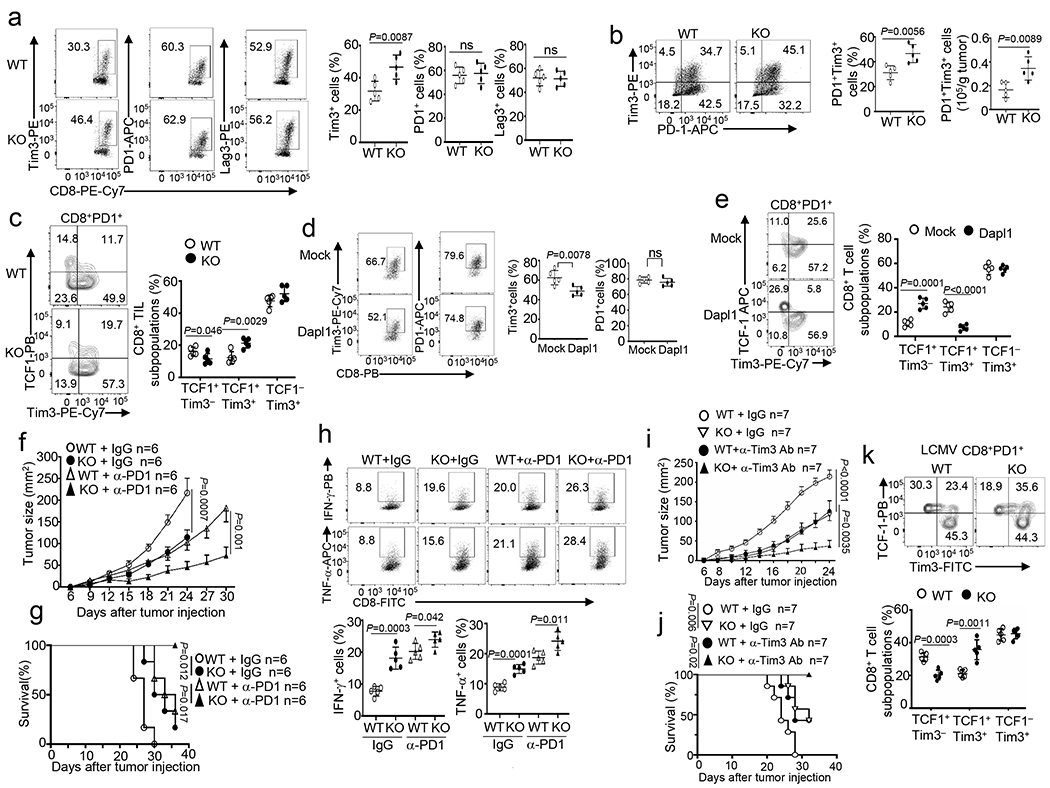
Fig. 2. Dapl1 deficiency promotes Tim3 expression and improves responses to ICR blockade.

a,b, Flow cytometry analysis of the frequency of Tim3+, PD1+ and Lag3+ CD8 T cells (a), and the frequency and absolute cell number of Tim3+ PD1+ CD8 TEX cells (b) in the tumor of B16-OVA-implanted wildtype (WT) and Dapl1 KO mice. n = 5 per genotype. c, Flow cytometry analysis of the frequency of TCF1+Tim3−, TCF1+Tim3+ and TCF1−Tim3+ subsets, gated on CD8+PD1+ T cells in the tumor of B16-OVA tumor-bearing wildtype or Dapl1 KO mice, n = 5 per genotype. d,e, Flow cytometry analysis of the frequency of Tim3+ and PD1+ CD8 T cells (d), TCF1+Tim3−, TCF1+Tim3+ and TCF1−Tim3+ subsets(e) in the tumor of B16F10-implanted B6.SJL mice (CD45.1+) adoptively transferred with Dapl1 KO Pmel1 CD8 T cells (CD45.2+) transduced with either an empty vector (Mock) or HA-Dapl1 expression vector (Dapl1). n = 5 per genotype. f-h, Tumor growth curves (f), survival curves (g) and flow cytometry analysis of the frequency of IFN-γ- or TNF-α- producing CD8 T cells in the tumor (h) of wildtype or Dapl1 KO mice injected subcutaneously with B16-OVA followed by i.p. injection with anti-PD1 (100 μg/mouse) or isotype control on days 7, 9, and 11. n = 6 (f,g) or n = 5 (h) per genotype. i,j, Tumor growth curves (i) and survival curves (j) of wildtype or Dapl1 KO mice injected subcutaneously with B16-OVA followed by i.p. injection with anti-Tim3 (200 μg/mouse) or isotype control on days 7, 9, and 11. n = 7 per genotype. k, Flow cytometry analysis of the frequency of TCF1+Tim3−, TCF1+Tim3+ and TCF1−Tim3+ subsets, gated on H2Db/GP33–41 tetramer+ CD8+PD1+ T cells in the spleen of wildtype or Dapl1 KO mice infected with LCMV clone 13 for 30 days, n = 5 per genotype. Data are representative of three independent experiments. Summary data are shown as the mean ± s.d. with P values determined using a two-tailed unpaired Student’s t-test (a-e, h, k), two-sided log-rank Mantel–Cox tests (g, j) and two-way ANOVA with Bonferroni correction (f, i). ns, not significant.
