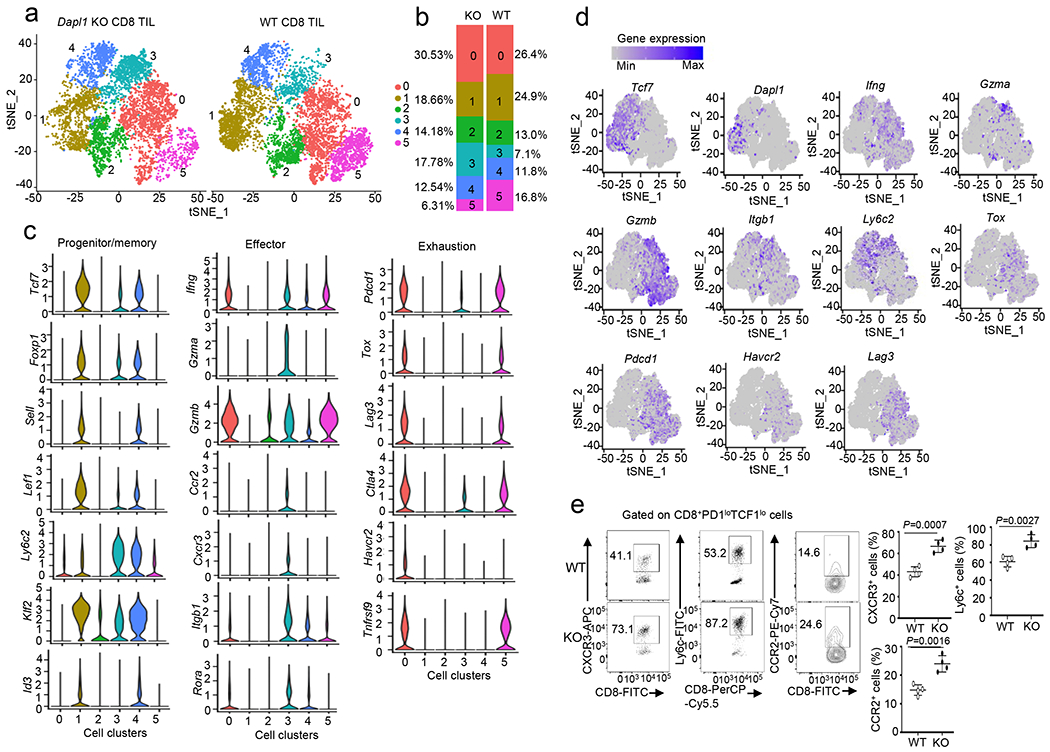
Fig. 4. Dapl1 deletion reprograms tumor-infiltrating CD8 T cells.

a, tSNE plot based on unsupervised clustering analysis of scRNAseq using tumor-infiltrating CD8+ T cells prepared from B16-OVA tumor-bearing wildtype or Dapl1 KO mice (day 22 tumor; combined from 6 tumors/genotype). The 6 clusters are labeled with different colors. b, Quantification of the proportion of WT or Dapl1 KO CD8 T cells in each cluster. c, Violin plots showing expression of genes associated with progenitor/memory, effector, and exhaustion functions in the indicated 6 clusters of CD8 TILs. d, Expression profile of the indicated genes in each cluster of CD8 TILs. e, Flow cytometry analysis of the frequency of CXCR3+, Ly6c+ or CCR2+ cells gated on PD1low TCF1low CD8 T cells derived from day 22 tumor of B16-OVA-bearing wildtype or Dapl1 KO mice. Data are presented as representative FACS plots (left) and summary graphs (right). n=4 per genotype. Summary data are shown as the mean ± s.d. with P values determined using a two-tailed unpaired Student’s t-test (e).
