
Fig. 5. Dapl1 is a specific regulator of NFATc2 activation.
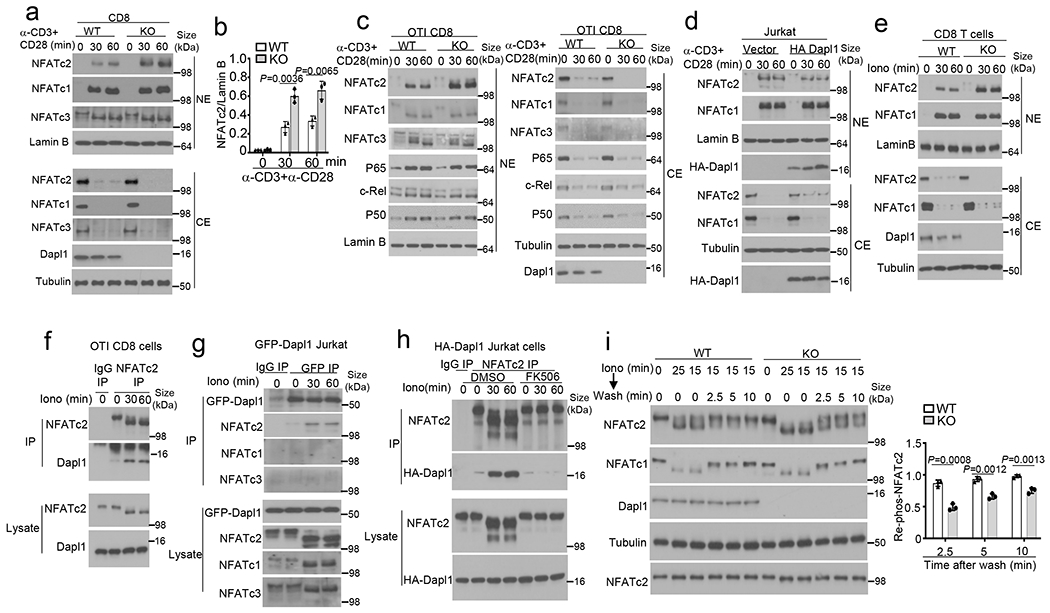
a,b, Immunoblot analysis of the indicated proteins in cytoplasmic (CE) and nuclear (NE) extracts of naive wildtype (WT) or Dapl1 KO CD8 T cells stimulated with anti-CD3 and anti-CD28 (a, b). Data are presented as a representative blot (a) and a summary graph of densitometric quantifications of NFATc2 (presented as NFATc2/LamninB ratio) based on three independent experiments (b). c,d, Immunoblot analysis of the indicated proteins in cytoplasmic (CE) and nuclear (NE) extracts of wildtype or Dapl1 KO OT-I CD8 T cells (c) and Jurkat T cells transduced with either an empty vector or HA-Dapl1 expression vector (d), stimulated with anti-CD3 and anti-CD28 for the indicated time points. e, Immunoblot analysis of the indicated proteins in cytoplasmic (CE) and nuclear (NE) extracts of naive wildtype or Dapl1 KO CD8 T cells stimulated with ionomycin. f-h, Co-IP analysis of NFATc2-Dapl1 interactions (upper panels) and direct IB analyses of the indicated proteins (lower panels) in ionomycin-stimulated wildtype OT-I CD8 T cells (f), Jurkat T cells transduced with a GFP-Dapl1 expression vector (g), or Jurkat T cells transduced with an HA-Dapl1 expression vector and pretreated with 20 nM FK506 or solvent control (DMSO) (h). i, Immunoblot analysis of NFATc2 or NFATc1 dephosphorylation and re-phosphorylation in whole cell lysates of wildtype or Dapl1 KO naïve CD8 T cells, stimulated with ionomycin for 15 min followed by washing and incubation in fresh medium without ionomycin for the indicated time points. Data are presented as a representative blot (left) and a summary graph of densitometric quantifications of re-phosphorylated NFATc2 (presented as phospho-NFATc2/total NFATc2 ratio) based on three independent experiments (right). Data are representative of three independent experiments. Summary data are shown as the mean ± s.d. with P values determined using a two- tailed unpaired Student’s t-test (b, i).