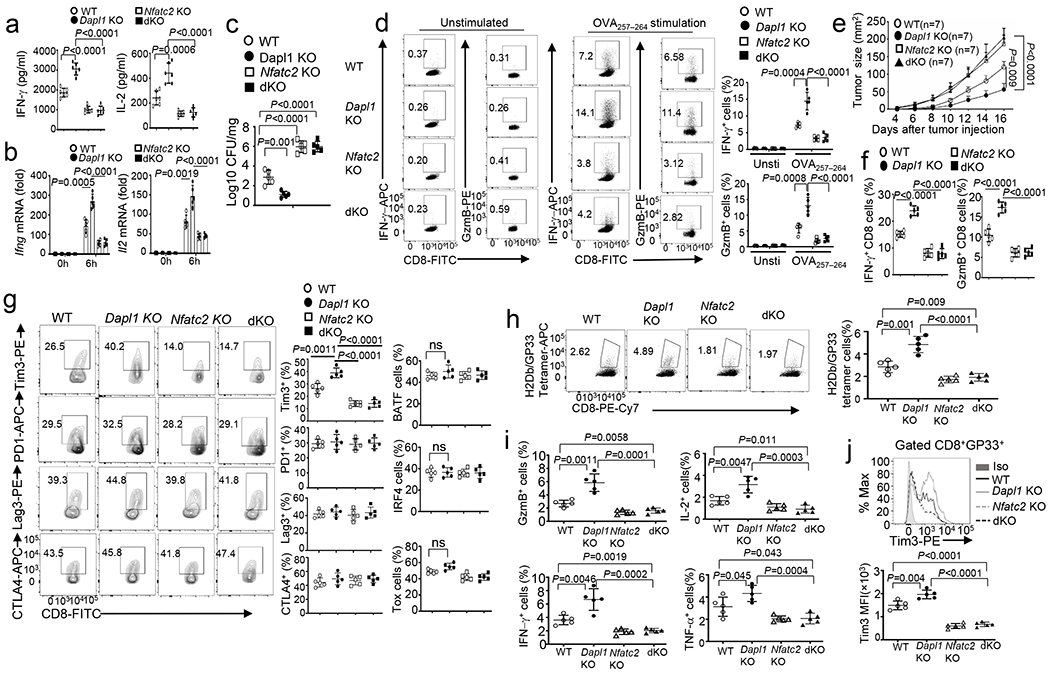
Fig. 6. NFATc2 mediates the effector function and Tim3 hyperexpression of Dapl1-deficient CD8 T cells.

a,b, ELISA of secreted IL-2 and IFN-γ (a) and qRT-PCR analysis of IFN-γ and IL-2 mRNA (b) in naive CD8 T cells from the indicated mouse strains, stimulated for 48h (a) or 6h (b) with anti-CD3 and anti-CD28. n =6 (a) or 5 (b) per genotype. c,d, Bacterial burden in the liver (c) and flow cytometry analysis of the frequency of splenic IFN-γ- or Granzyme B- producing CD8 effector T cells following in vitro restimulation with OVA peptide or medium control (unstimulated) (d) of wildtype (WT), Dapl1 KO, NFATc2 KO and Dapl1-NFATc2 dKO (dKO) mice infected with LM-OVA for 7 days. n =5 per genotype. e-g, Tumor growth curve (e) and flow cytometry analysis of the frequency of IFN-γ- or Granzyme B-producing CD8 T cells (f) and CD8 T cell subsets expressing the indicated molecules (g) in the tumor of B16-OVA-bearing wildtype, Dapl1 KO, NFATc2 KO and Dapl1-NFATc2 dKO mice. n =7 per genotype (e), and n =5 per genotype (f,g). h-j, Flow cytometry analysis of the frequency of H2Db/GP33–41 Tetramer+ CD8 T cells (h), Granzyme B-, IFN-γ-, IL-2- or TNF-α-producing CD8 effector T cells (i), and Tim3 expression level on H2Db/GP33–41 Tetramer+ CD8 T cells (j) in the spleen of wildtype, Dapl1 KO, NFATc2 KO and Dapl1-NFATc2 dKO mice infected with LCMV clone 13 for 30 days. n =5 per genotype. Data are representative of three independent experiments. Summary data are shown as the mean ± s.d. with P values determined using a two-tailed unpaired Student’s t-test (a-d, f-j) and two-way ANOVA with Bonferroni correction (e).
