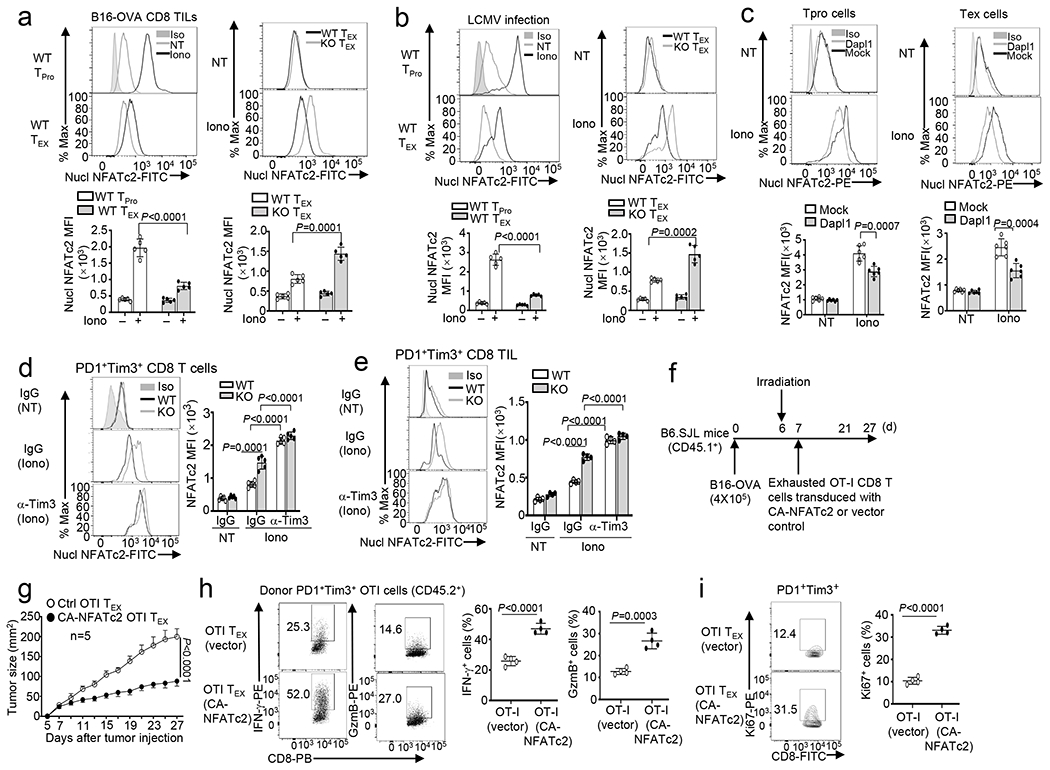
Fig. 8. Exhausted CD8 T cells display suppressed NFATc2 activation, which can be rescued by Dapl1 deletion or Tim3 blockade.

a,b, Flow cytometry analysis of nuclear NFATc2 in PD1− Tim3− progenitor (TPro) or PD1+Tim3+ CD8 TEX cells isolated from the tumors of B16-OVA-bearing wildtype (WT) or Dapl1 KO mice (a) or LCMV clone 13-infected wildtype or Dapl1 KO mice (b), either not treated (NT) or stimulated with ionomycin (Iono) for 30 min. n =5 per genotype. c, Flow cytometric analysis of nuclear NFATc2 in untreated (NT) or ionomycin-stimulated (Iono, 30 min) PD1+Tim3+ TEX and PD1−Tim3− progenitor (TPro) CD8 TILs derived from the tumor of B16F10-implanted B6.SJL mice (CD45.1+) adoptively transferred with vector- or Dapl1-transduced Dapl1 KO Pmel1 CD8 T cells (CD45.2+) as defined in Extended Data Fig. 2k–l. n =6 per genotype. d,e, Flow cytometry analysis of nuclear NFATc2 in PD1+Tim3+ exhausted CD8 T cells sorted from the spleen of wildtype or Dapl1 KO mice infected with LCMV clone 13 for 30 days and injected i.p. with anti-Tim3 (100 μg/mouse) or IgG isotype control every 3 days (d) or sorted from the tumor of B16-OVA-bearing wildtype or Dapl1 KO mice injected with anti-Tim3 (200 μg/mouse) or isotype IgG control on days 7, 9, and 11 (e). The cells were either not treated (NT) or stimulated with ionomycin (Iono) for 30 min. n =5 per genotype (d) or n =4 per genotype (e). f-i, Schematic of experimental design (f), tumor growth curve (g) and flow cytometry analysis of the frequency of IFN-γ- or granzyme B-producing cells (h) or Ki67+ proliferating cells (i) within the gated PD1+Tim3+ OT-I CD8 T cell population (CD45.2+) in the tumor of B16-OVA-bearing B6.SJL mice (CD45.1+) adoptively transferred with in vitro exhausted OT-I CD8 T cells transduced with either an empty vector or CA-NFATc2. n=5 (g) or 4 (h,i) per genotype. Data are representative of three independent experiments. Summary data are shown as the mean ± s.d. with P values determined using a two-tailed unpaired Student’s t-test (a-e, h,i) and two-way ANOVA with Bonferroni correction (g).
