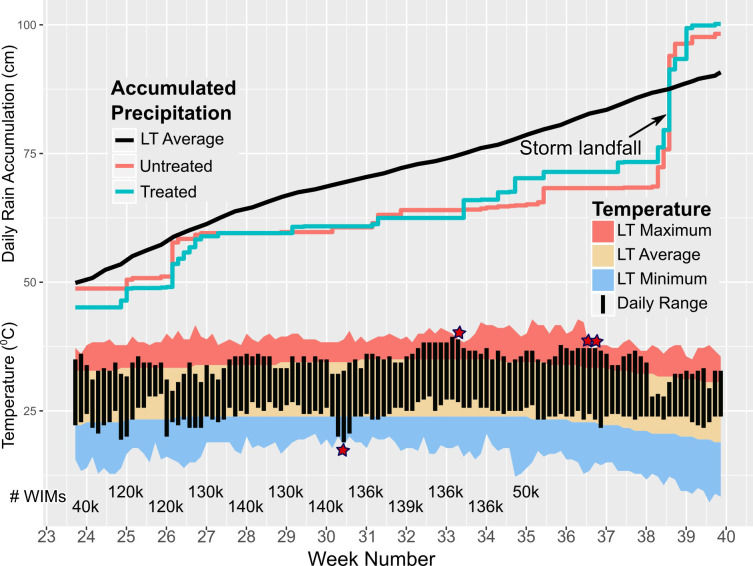
Fig 1. Average and observed daily cumulative rainfall, and temperature.
Rainfall for each area was recorded at the nearest Harris County Flood Warning System weather station. The Long-term Rainfall (LT rainfall) is a 20-year average (1981–2001) recorded at Houston’s George Bush Intercontinental Airport (IAH). The LT Maximum, Average, and Minimum are 20-year averages (1981–2001) recorded at IAH. The observed daily temperature (bar; top of the bar observed maximum; bottom of the bar observed minimum) was recorded at IAH. Red stars show days when the temperature broke or tied the LT maximum or minimum. The number of released WIMs per week is presented at the bottom of the plot (k = x 1000). Climate and Weather data Source: National Weather Service and Harris County Flood Warning System. Raw data in S3 File.

