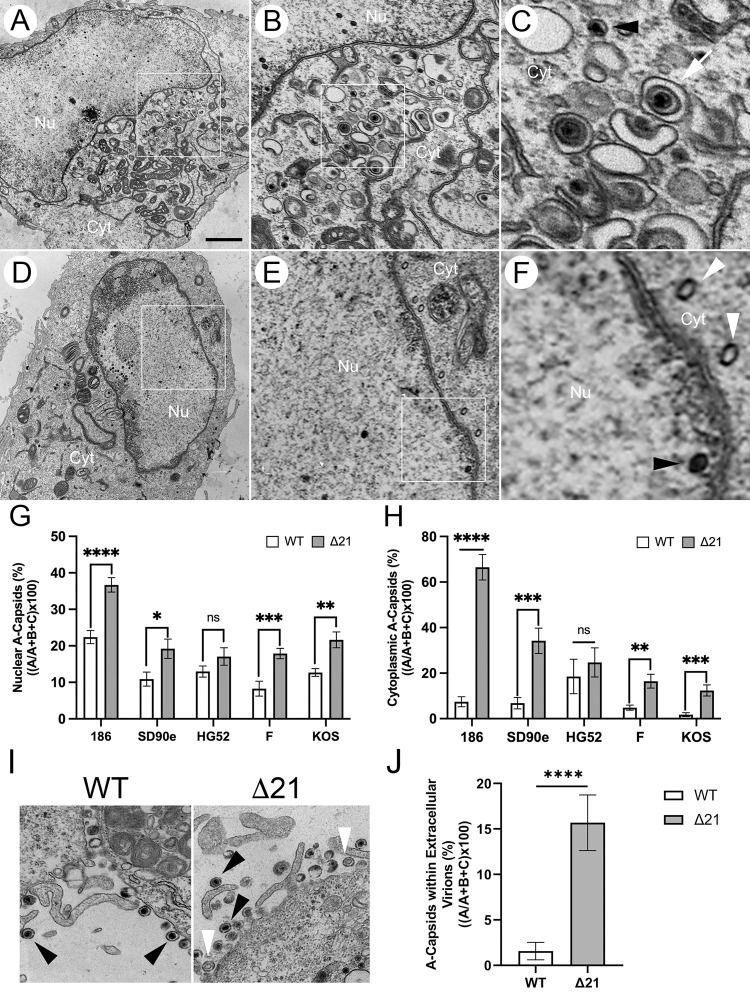
Fig 1. Nuclear and cytoplasmic A-capsid accumulation in HSV WT and Δ21 strains.
Vero cells were infected with either an HSV-1 or HSV-2 WT virus or its corresponding Δ21 mutant at an MOI of 3. At 18 hpi, samples were fixed and prepared for TEM. Micrographs for each strain of HSV-1 and HSV-2 were obtained and WT and Δ21 capsids in the nucleus and cytoplasm of infected cells were quantified. A-F) Example micrographs of HSV-2 SD90e WT (A, B, and C) compared to its Δ21 mutant (D, E, and F). As depicted in the Δ21 panels (E and F), there is an abundance of A-capsids (white arrowheads) compared to the WT strain (B and C). Black arrowheads indicate C-capsids and white arrows indicate enveloped C-capsids. The 2μm scale bar applies to panels A and D. Panels B and E are three-fold magnified images of panels A and D. Panels C and F are three-fold magnified images of panels B and E. G) The quantification of nuclear A-capsids in cells infected with HSV WT and Δ21 strains are depicted (n = 9–12 micrographs per condition). H) The quantification of cytoplasmic A-capsids in cells infected with HSV WT and Δ21 strains are depicted (n = 11–14 micrographs per condition). I) Example micrographs of HSV-1 F WT and Δ21 extracellular virions. As depicted in the Δ21 mutant micrograph, there is an abundance of A-capsids within Δ21 extracellular virions (white arrowheads) compared to the WT strain which has mostly C-capsids in extracellular virions (black arrowheads). J) The quantification of A-capsids within HSV-1 F WT and Δ21 extracellular virions are depicted (n = 11–14 micrographs per condition). Unpaired t-tests were conducted between Δ21 mutants and WT viruses. *, **, ***, and **** represent p ≤ 0.05, p ≤ 0.01, p ≤ 0.001 and p ≤ 0.0001, respectively. ns = not significant.

