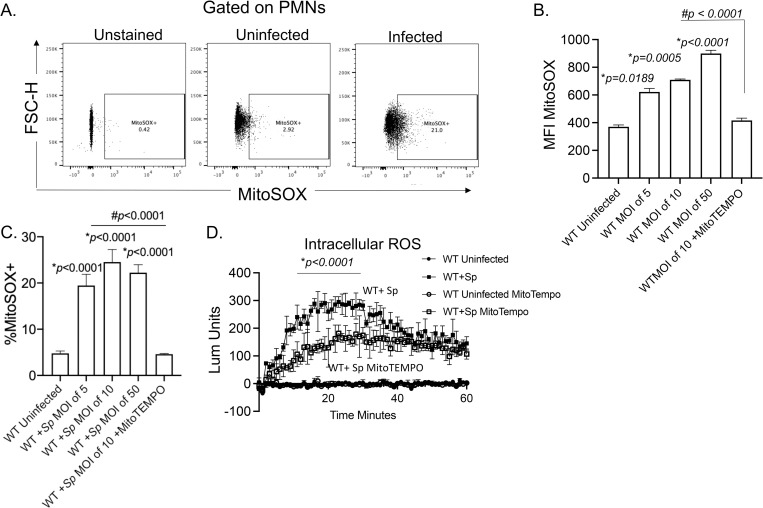
Fig 1. Mitochondrial ROS are produced by PMNs in response to Streptococcus pneumoniae infection.
WT (C57BL/6) bone marrow-derived PMNs were infected with S. pneumoniae TIGR4 at various MOIs for 10 minutes and mitochondrial ROS measured using MitoSOX. (A) Gating strategy. (B) The geometric Mean Fluorescent Intensity (MFI) or (C) % of mitochondrial ROS producing cells were determined by flow cytometry. (D) PMNs were treated with vehicle control or the mitochondrial ROS scavenger MitoTEMPO and then mock treated (uninfected) or infected with S. pneumoniae (+Sp) TIGR4 at a MOI of 50. Cells were monitored for intracellular ROS production over the course of 60 minutes using chemiluminescent luminol. (B-D) Representative data shown are from 1 out of 5 separate experiments in which n = 3 technical replicates were used per condition. Line and Bar graphs represent the mean +/-SD. (B and C) * indicates significant differences from uninfected controls and # indicates significant differences between the indicated groups as measured by one-way ANOVA followed by Tukey’s multiple comparison test. (D) * indicates significant differences between infected groups +/- MitoTEMPO as determined by 2-way ANOVA followed by Tukey’s multiple comparisons test.

