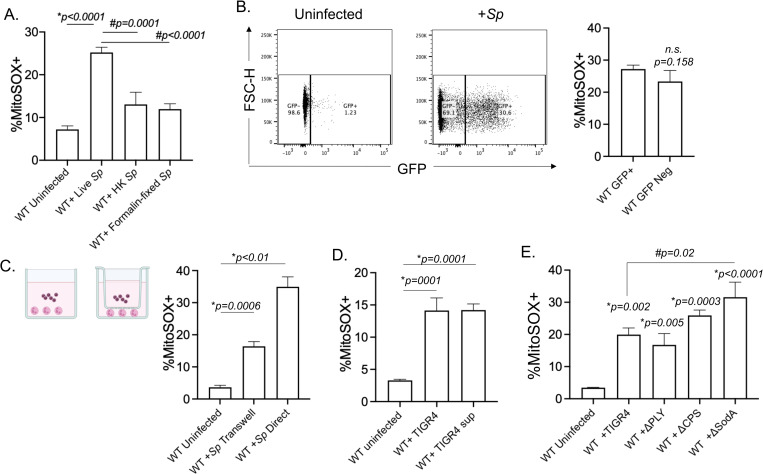
Fig 2. Bacterial factors required for mitochondrial ROS production by PMNs.
(A) WT (C57BL/6) bone-marrow derived PMNs were mock-treated (Uninfected) or infected with Live (Live Sp), heat-killed (HK Sp) or formalin fixed (Formalin-fixed Sp) S. pneumoniae TIGR4 at a MOI of 10 for 10 minutes and mitochondrial ROS was measured using MitoSOX. Data are representative of 1 out of 3 separate experiments in which n = 3 technical replicates were used per condition. (B) WT PMNs were infected with GFP-expressing S. pneumoniae TIGR4 at a MOI of 10 for 10 minutes. GFP positive vs. negative populations were gated on and compared for production of mitochondrial ROS using MitoSOX by flow cytometry. Data are representative of 1 of 5 experiments in which n = 3 technical replicates were used per condition. (C) WT PMNs were seeded in 24-well plates and either directly infected with S. pneumoniae TIGR4 at a MOI of 10, or were separated from the bacteria by a trans-well. The % of MitoSOX+ cells were determined using flow cytometry. Data are representative from 1 of 3 separate experiments in which n = 3 technical replicates were used per condition. (D) PMNs were either directly infected with S. pneumoniae TIGR4 at a MOI of 10, or treated with bacterial supernatant. The % of MitoSOX+ cells were determined using flow cytometry. Data are representative from 1 of 4 separate experiments in which n = 3 technical replicates were used per condition. (E) WT PMNs were mock-treated (Uninfected) or infected at a MOI of 10 for 10 minutes with either wild type S. pneumoniae TIGR4 (+TIGR4), a pneumolysin deletion mutant (+ΔPLY), a capsular deletion mutant (+ΔCPS) or bacteria lacking superoxide dismutase (+ΔsodA). The % of MitoSOX+ cells were determined by flow cytometry. Data are representative of 1 out of 5 separate experiments in which n = 3 technical replicates were used per condition. Bar graphs represent the mean +/-SD. * indicates significant differences from uninfected controls and # indicates significant differences between indicated groups as measured by one-way ANOVA followed by Tukey’s multiple comparison test. n.s. indicates not significant.

