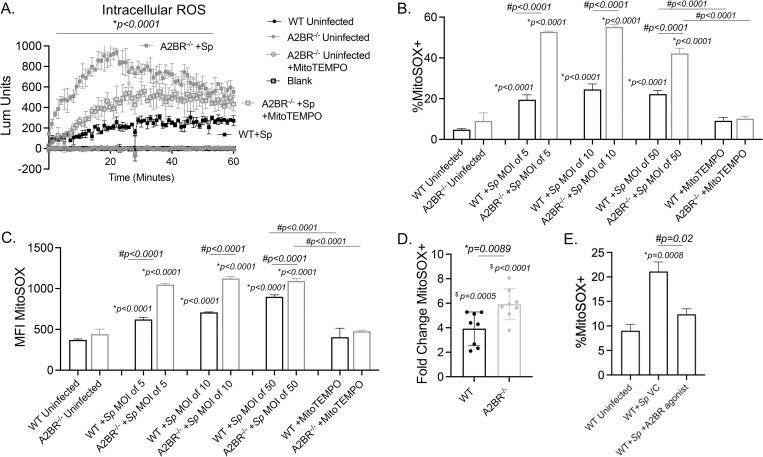
Fig 5. A2B adenosine receptor signaling blunts mitochondrial ROS production.
(A) A2BR-/- (grey) and WT (black) bone-marrow derived PMNs were mock treated (uninfected) or infected with S. pneumoniae (+Sp) TIGR4 at a multiplicity of infection (MOI) of 50 in the presence or absence of MitoTEMPO. Cells were monitored for intracellular ROS production over 60 minutes using luminol. Data are representative from 1 of 3 experiments in which n = 3 technical replicates were used per condition. * indicates significant differences between infected A2BR-/- and WT controls as well as infected A2BR-/- +/- MitoTEMPO treatment as determined by 2-way ANOVA followed by Tukey’s multiple comparisons test. Line graphs represent the mean +/-SD. (B-C) WT (Black) and A2BR-/- (light grey) marrow-derived PMNs were infected with S. pneumoniae TIGR4 at the indicated MOIs for 10 minutes. +MitoTEMPO were treated with the drug prior to infection at an MOI of 50. (B) The % of MitoSOX+ cells as well as (C) the amount of MitoSOX produced (geometric MFI) were determined using flow cytometry. (B-C) Representative data shown are from 1 out of 8 separate experiments in which n = 3 technical replicates were used per condition. Bar graphs represent the mean +/-SD. * indicates significant differences from uninfected controls and # indicates significant differences between the indicated groups as measured by one-way ANOVA followed by Tukey’s multiple comparison test. (D) Fold increases in MitoSOX+ cells upon bacterial infection were calculated by dividing the values of infected conditions by uninfected controls for each mouse strain. Data pooled from eight separate experiments (n = 8 mice/ group) are shown. $ indicates significantly different from 1 as measured by one-sample t-test and * indicates significant differences between the indicated groups as measured by Student’s t-test. (E) WT PMNs were treated with vehicle control (VC) or the A2BR Agonist BAY60-6583 for 30 minutes. Cells were then mock-treated (Uninfected) or infected with S. pneumoniae TIGR4 at a MOI of 10 for 10 minutes. The % of mitochondrial ROS producing cells were determined by flow cytometry. Representative data shown are from 1 out of 5 separate experiments in which n = 3 technical replicates were used per condition. Bar graphs represent the mean +/-SD. * indicates significant differences from uninfected controls and # indicates significant differences between the indicated groups as measured by one-way ANOVA followed by Tukey’s multiple comparison test.

