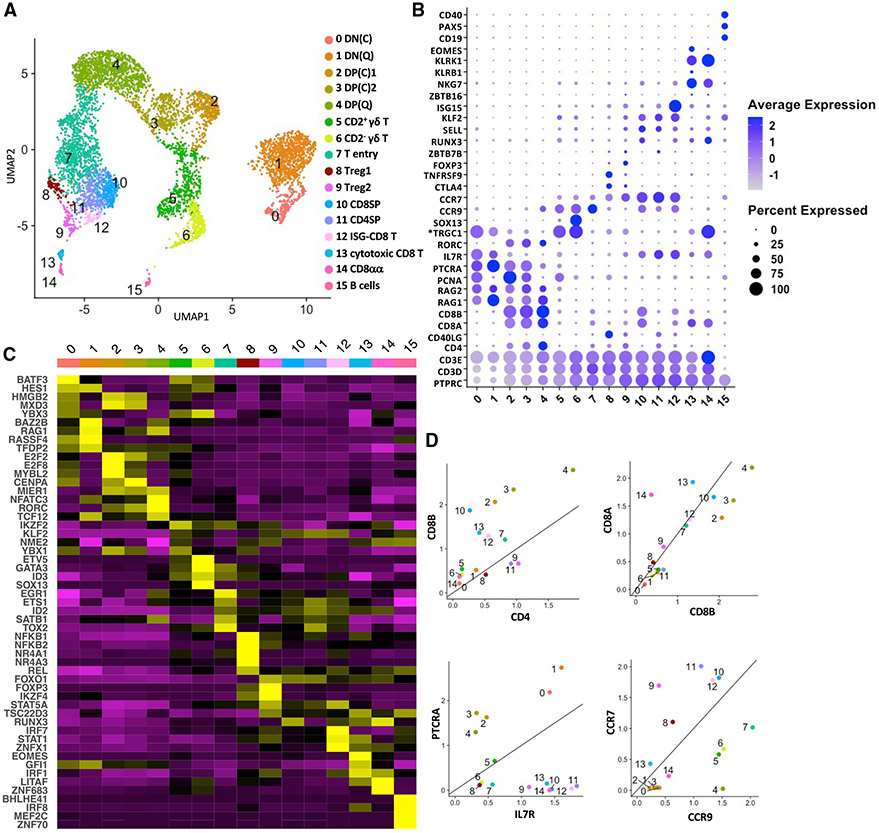
Figure 1. Single-cell transcriptomics analysis of the cellular composition of the pig thymus.
(A) Uniform manifold approximation and projection (UMAP) visualization of pig thymus cell types, colored by cell clusters. Clusters were identified using the graph-based Louvain algorithm at a resolution of 0.5.
(B)Dot plot showing the Z-scored mean expression of marker genes that were used to designate cell types to cell clusters. The color intensity represents average expression of each marker gene in each cluster. The dot size indicates the proportion of cells expressing each marker gene. Genes with cluster-specific increases in expression are presented in Table S2.
(C) Heatmap showing row-scaled mean expression of the five highest differentially expressed transcription factors in each cluster.
(D) Scatterplots showing the ratio of various lineage marker genes for each thymocyte cluster (excluding B cells). Asterisks indicate non-annotated genes (described in Table S13).

