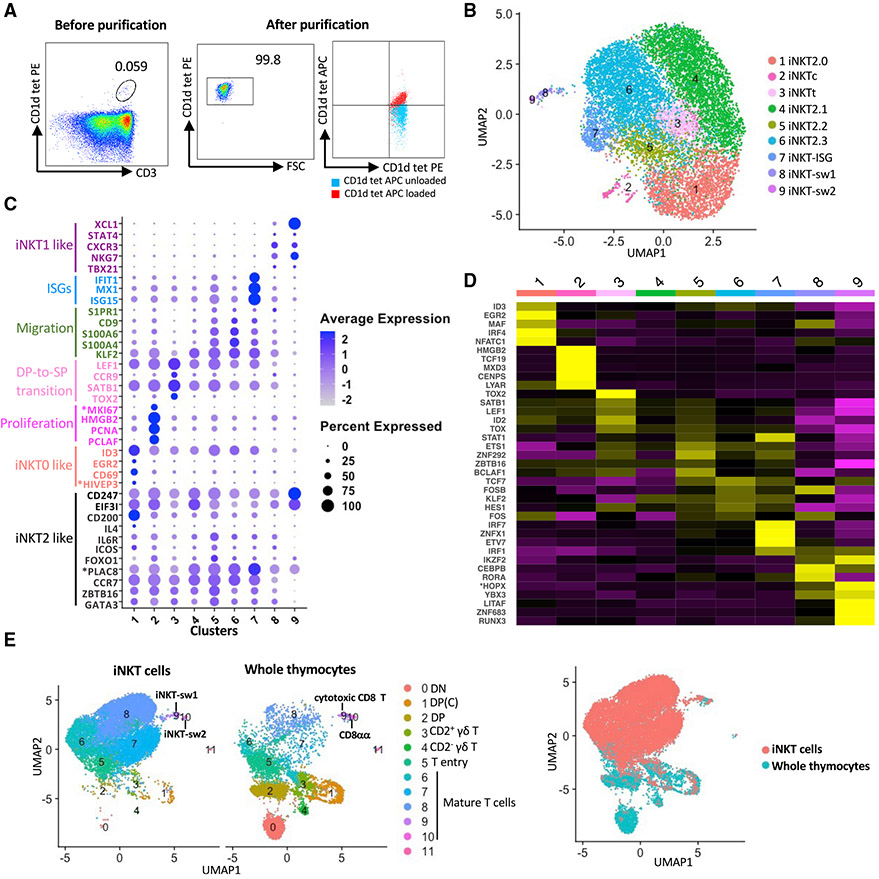
Figure 5. scRNA-seq analysis of porcine thymic iNKT cells.
(A) Flow cytometry showing thymic phycoerythrin (PE)-conjugated mouse (m)CD1d tetramer+ cells before (left panel) and after (center panel) isolation with magnetic beads and FACS. Purity was confirmed by co-staining with allophycocyanin (APC)-conjugated PBS57-loaded or unloaded mCD1d tetramers (right panel).
(B) UMAP visualization of iNKT thymocyte clusters identified using the graph-based Louvain algorithm at a resolution of 0.5.
(C) Dot plot showing the Z-scored mean expression of selected genes encoding key transcription factors and thymocyte differentiation markers for each cluster.
(D) Heatmap showing row-scaled mean expression of the five highest differentially expressed transcription factors per cluster.
(E) Integrative analysis of iNKT cells and whole thymocytes (excluding B cells) from the same pigs. Asterisks indicate non-annotated genes (described in Table S13).

