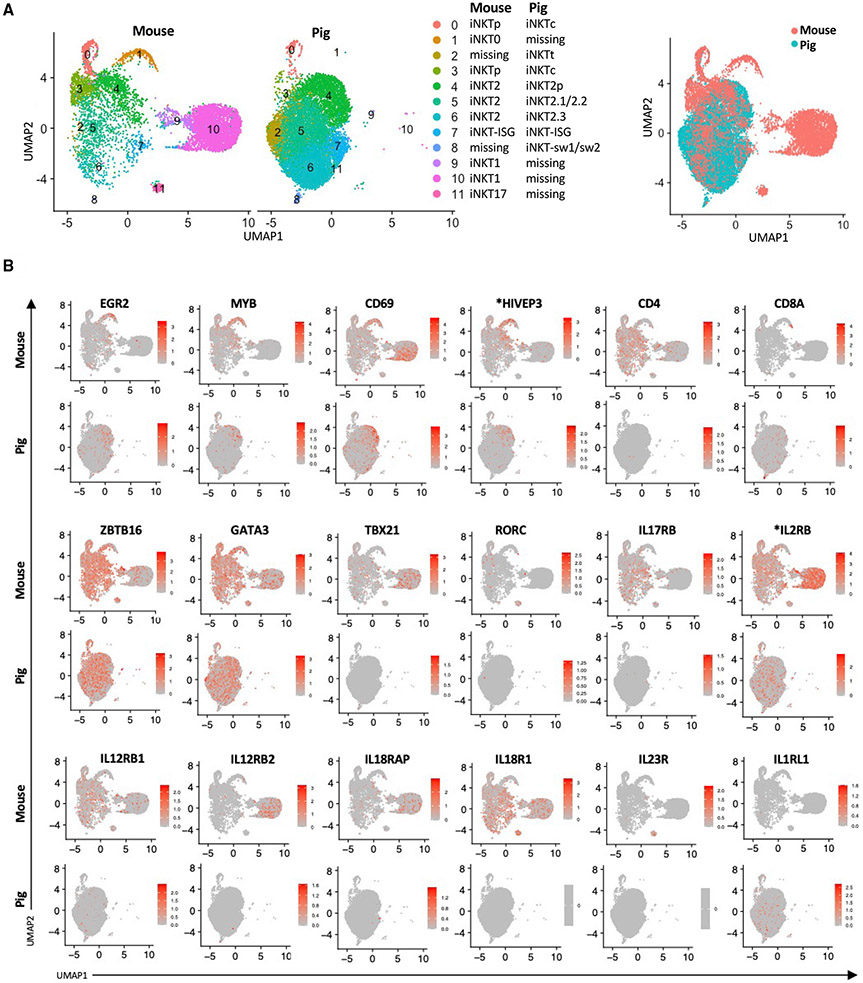
Figure 6. Integrative analysis of pig and mouse thymic iNKT cells.
(A) UMAP plots showing the integrative data analyses of thymic iNKT cells from pig and mouse. A public dataset containing thymic iNKT cells isolated from 8- to 9-weeks old C57BL6/J mice was used (Harsha Krovi et al., 2020). Overlapping clusters are in the same figure legend row. Cell clusters that are absent in one species are annotated as “missing.”
(B) Expression of 18 genes typically used to distinguish the major subsets of mouse iNKT cells. Asterisks indicate non-annotated genes (described in Table S13).

