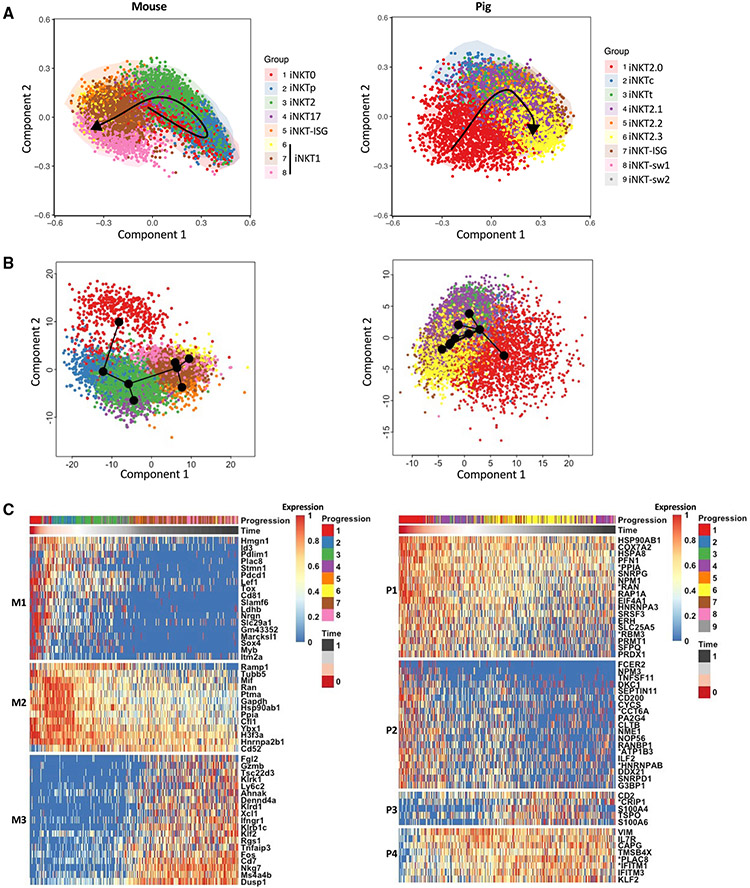
Figure 7. Unsupervised analysis of mouse and pig iNKT cell differentiation.
(A and B) Mouse and pig iNKT cells were ordered along their respective differentiation trajectories via unsupervised SCORPIUS (A) and Slingshot (B) analyses.
(C) The top 50 most important mouse (left panel) and pig (right panel) genes with respect to the inferred trajectory were, respectively, clustered into three (M1–M3) and four (P1–P4) gene modules by SCORPIUS. Normalized expression values are scaled from 0 to 1 using the scale_quantile function of SCORPIUS with default parameters.

