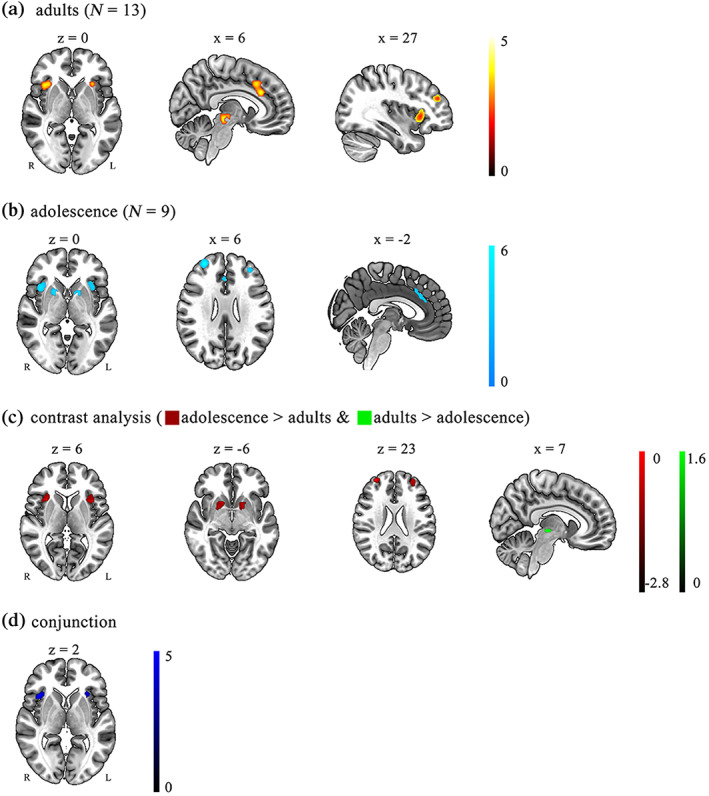
FIGURE 4.

Significant clusters from the risk‐taking for adults group, adolescents groups, and conjunction and contrast between them. (a) Adult risk‐taking; (b) Adolescent risk‐taking; (c) The contrast of adults versus adolescents, red brain regions show higher activation in the adolescent group; green brain regions show higher activation in the adult group; (d) The conjunction of adults and adolescence. All the results were thresholded by FWE correction p < .05 (cluster‐forming threshold of p < .001 using 25,000 permutations)
