
FIGURE 6.
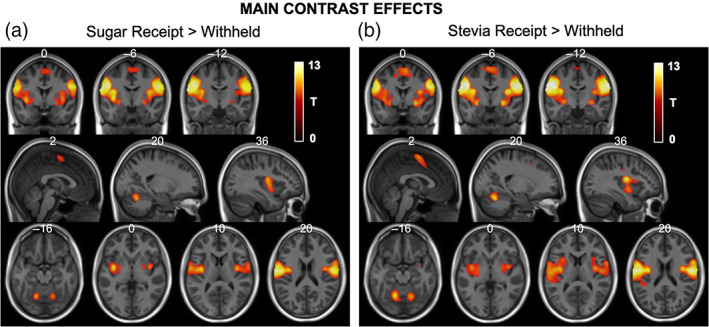
Statistical T‐maps for main receipt contrast effects overlaid onto structural MNI images. (a) The sugar receipt > withheld linear contrast showed statistically significant areas of activation within the bilateral oral somatosensory regions, insula cortex, putamen, supplementary motor area as well as regions of the cerebellum. (b) Similarly, the stevia receipt > withheld linear contrast also showed statistically significant areas of activation within the bilateral oral somatosensory regions, insula cortex, putamen, supplementary motor area as well as regions of the cerebellum. MNI co‐ordinates are labelled at the top of each slice and only significant clusters are displayed