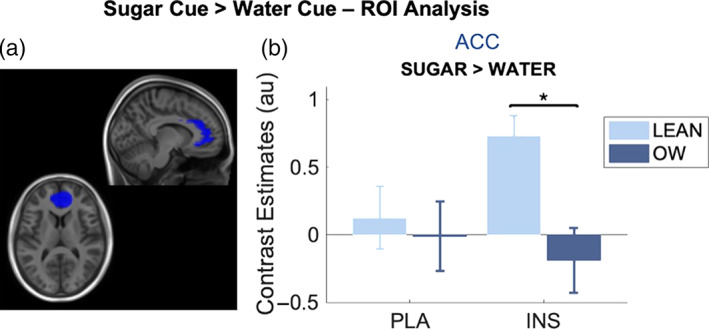
FIGURE 8.

ROI analysis from the (a) ACC ROI (blue), (b) bar graph showing extracted contrast estimates from the ACC in both groups and under both IN‐PLA and IN‐INS conditions for the sugar cue > water cue contrast. Estimates are from contrast images. A significant difference between lean and OW group contrast estimates was observed in this region, exclusively under insulin conditions. Data are presented as mean ± SEM, *p < .05. Lean (n = 10), OW (n = 14)
