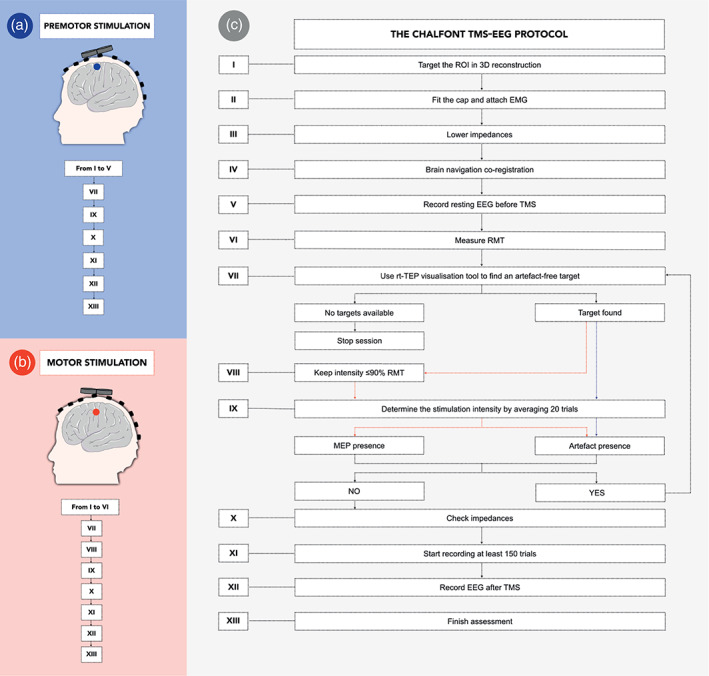
FIGURE 1.

The “Chalfont TMS‐EEG” protocol. Illustration describing our internal protocol for stimulation of premotor (target represented by blue circle, panel a) and motor (red circle, panel b) cortical targets. Panel c illustrates our workflow and can be used as reference to reproduce this work. Additional details of our protocol are provided in the Supplementary Material S1. avg‐ref, average reference; EMG, electromyography; RMT, resting motor threshold; ROI, region of interest; rt‐TEP = real‐time visualisation tool
