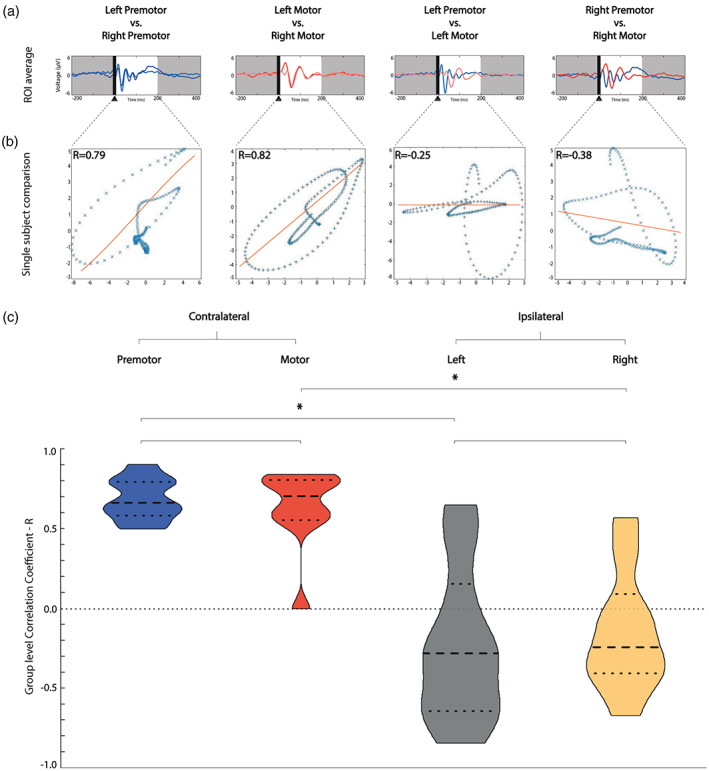
FIGURE 3.

Correlation coefficient is higher when comparing contralateral homologous TEPs than ipsilateral TEPs. (a) Comparison of voltage distribution over time on the average of the four channels closest to the stimulation (ROI) for one representative participant (P1). We represented left premotor stimulation in light blue, right premotor stimulation in dark blue, left motor stimulation in light red, right motor stimulation in dark red. (b) This panel shows the association analysis of the voltages of the evoked potentials presented in panel a between 20 and 200 ms from the TMS pulse, using the Pearson's correlation coefficient. (c) Violin plot with median and interquartile range (bold and light dashed lines, respectively) of the intra‐participant correlation coefficient calculations. Contralateral homologous CAs correlation coefficients are represented in the two violin plots on the left, ipsilateral correlation coefficients are represented in the two violin plots on the right. Horizontal lines represent statistic tests, * represents significant difference. Premotor contralateral homologous comparisons are coloured in blue, motor contralateral in red, ipsilateral left in grey, ipsilateral right in yellow. CA, cortical area; ROI, region of interest; TEP, TMS‐evoked EEG potential; TMS, transcranial magnetic stimulation
