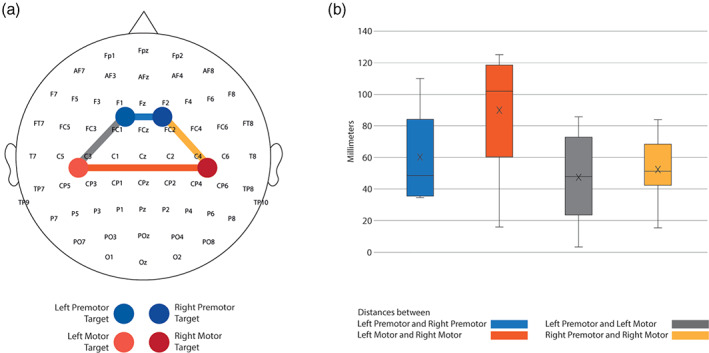
FIGURE 5.

Relative stimulation distances and locations. We used the coordinates from the brain navigation software to calculate the distances between ipsilateral and contralateral homologous target stimulations. (a) Topography of all the targets that we stimulated across participants. The interconnected coloured lines represent the distances we calculated between different targets. Blue represents the distance between left premotor and right premotor targets. Red represents the distance between left motor and right motor targets. The grey colour coding shows the distances between left premotor and left motor, and yellow represents the distance between right premotor and right motor. (b) Box plot of the average of the distances in all the targets we stimulated across all participants. The black line crossing the bars represents the median of each target. The cross inside the bars represents the mean of each target.
