
FIGURE 2.
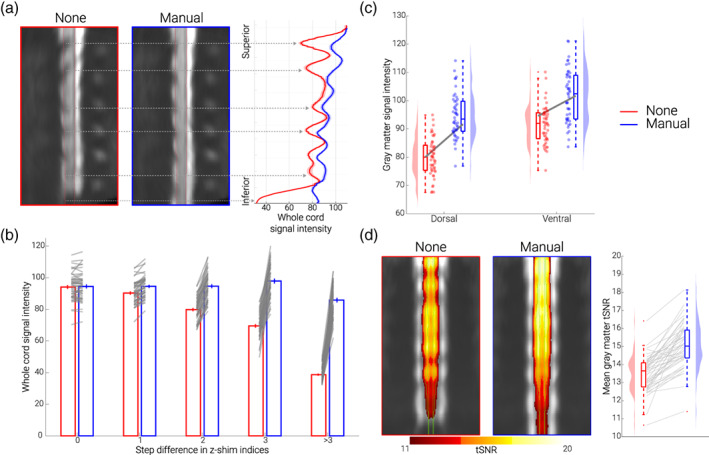
Replication and extension of previous results. (a) Direct replication of Finsterbusch et al. (2012). The mid‐sagittal EPI sections consist of the group‐average single volume EPI data in template space of 48 participants acquired under different conditions (no z‐shim and manual z‐shim); red lines indicate the spinal cord outline. On the right side, group‐averaged signal intensity in the spinal cord is shown for no (red) and manual (blue) z‐shim sequences along the rostro‐caudal axis of the cord. The solid line depicts the mean value and the shaded area depicts the standard error of the mean. (b) Slice‐by‐slice characterization of z‐shim effects. Bar graphs are grouped according to the absolute step size difference in the z‐shim indices (x‐axis) between no z‐shim (red) and manual z‐shim (blue) selections. The bars depict the mean signal intensity in the spinal cord for 48 participants for no and manual z‐shim single volume acquisitions in native space. The vertical lines depict the standard error of the mean and the gray lines indicate participant‐specific mean signal intensity changes between the no and manual z‐shim conditions. (c) Z‐shim effects in gray matter regions. Signal intensity changes in different gray matter regions (dorsal horn, ventral horn) under different conditions (no z‐shim, manual z‐shim) are depicted via box‐plots and raincloud plots. For the box plots, the median is denoted by the central mark and the bottom and top edges of the boxes represent the 25% and 75%, respectively, with the whiskers encompassing ~99% of the data and outliers being represented by red dots. The circles represent individual participants and half‐violin plots show the distribution of the gray matter intensity values across participants. The thick gray lines show the mean signal intensity across participants in the dorsal and ventral gray matter under different conditions. (d) Z‐shim effects on time‐series data. Group‐average coronal tSNR maps for the no z‐shim and manual z‐shim conditions as obtained from the motion‐corrected EPI data in template space. The maps are overlaid onto the group‐average mean image of the motion‐corrected EPI data and depict a tSNR range from 11 to 20. The green line marks the outline of the gray matter. In the right panel, the participant‐specific mean gray matter tSNR of the data acquired with and without z‐shim are shown. Box plots are identical to those in C, the gray lines indicate individual tSNR changes between both conditions and the half‐violin plots show the distribution across participants