. 2022 Nov 28;11:e78754. doi: 10.7554/eLife.78754

Figure 4. Normalizing H19 expression through the maternal deletion of H19.

(A) A schematic representation of the rescue breeding between △H19 heterozygous female and hIC1/+ male mice. △H19/hIC1 embryos are expected to express H19 only from the paternal allele and maternally express Igf2 in a tissue-specific manner. (B) Ratio of +/hIC1 and △H19/hIC1 embryos observed in E11.5 and E17.5 litters (mean ± SD). 8 E11.5 litters and 15 E17.5 litters with litter size larger than five pups were examined. Each data point represents one litter. (C) Relative fetal weights of wild-type, △H19/+, +/hIC1, and △H19/hIC1 embryos at E11.5 and E17.5, normalized to the average body weight of the wild-type littermates (mean ± SD). (D) Representative cross-sections of wild-type, △H19/+ and △H19/hIC1 embryonic hearts at E13.5 and E17.5, stained with hematoxylin and eosin. Note the cushion defect at E13.5 and the ventricular septal defect (VSD) at E17.5 in △H19/hIC1 hearts (yellow arrows). All E13.5 samples and E17.5 wild-type sample are male, and E17.5 △H19/+ and △H19/hIC1 samples are female. Scale bars = 500 µm. (E) Top: Representative cross-section of E17.5 △H19/hIC1 male placenta stained with hematoxylin and eosin. Black arrowheads indicate thrombi. Scale bar = 1 mm. Bottom: Number of the wild-type, male, and female +/hIC1 placentas with thrombi observed. (F) Relative total expression of H19 and Igf2 in E17.5 wild-type, △H19/+, +/hIC1, and △H19/hIC1 hearts (mean ± SD). (C and F) Each data point represents an individual conceptus from different litters. Statistics used are (B, C, and F) one-way ANOVA with Tukey’s multiple comparisons test and (E) Fisher’s exact test. *p<0.05, **p<0.01, ***p<0.001, ****p<0.0001, and ns = not significant.

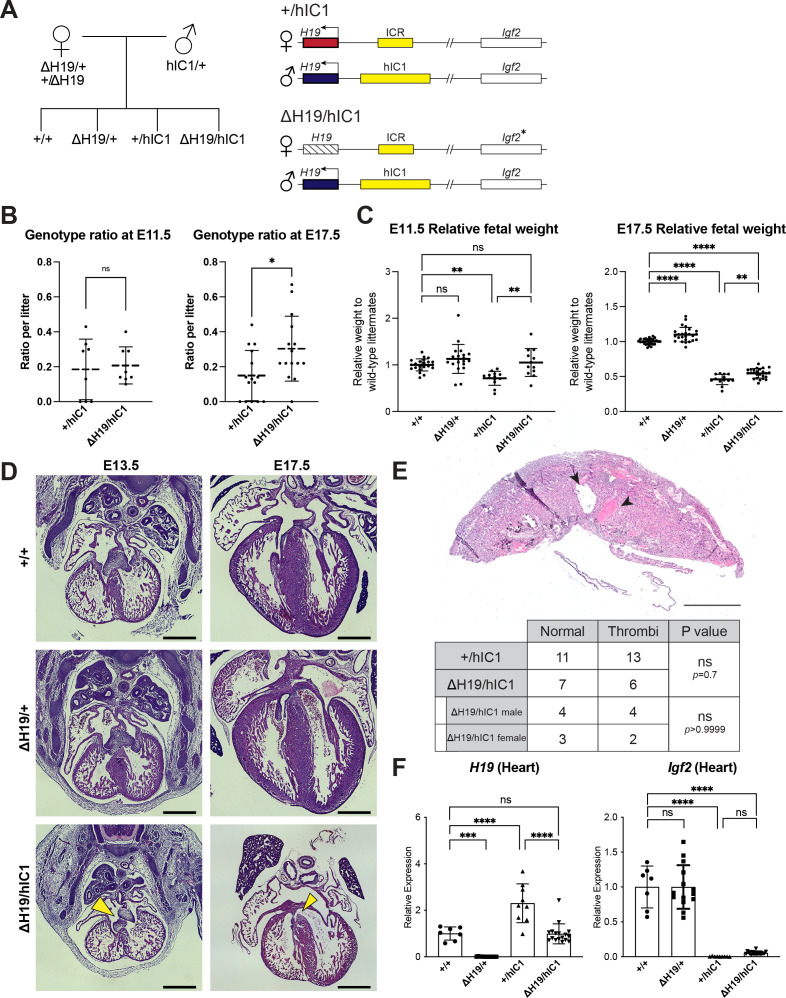
Figure 4.

Figure 4—figure supplement 1. Characterization of ΔH19 allele.

Figure 4—figure supplement 1.

(A) Targeting strategy to generate the ΔH19 allele. The endogenous H19 locus is shown with restriction sites, gRNA locations used to generate the deletion and binding sites for probes used in Southern blot analysis (thick lines). (B) Southern blot analysis of ΔH19 allele. Founder 4131 line was generated using gRNA pair A, and founder 4133 line was generated using gRNA pair B (Supplementary file 1). 3’ probe and 5’ probe were hybridized to XbaI- and KpnI-digested DNA, respectively. The sizes of the DNA fragments are shown on the right. (C) Allele-specific Igf2 expression in wild-type and ΔH19/+ neonatal tongue, heart, and liver analyzed by restriction fragment length polymorphism (RFLP). Ladder, genotypes and c (Mus castaneus, paternal) and b (C57BL/6, maternal) allele controls are indicated above each gel. Quantification of band densitometry is shown below each gel, with percent of maternal allele expression relative to paternal allele indicated. No expression from the maternal Igf2 allele was observed in liver. (D) Embryonic and neonatal body weight of the wild-type (blue) and ΔH19/+ (green) samples at E11.5, E12.5, E14.5, E17.5, E18.5, and PN0 (mean ± SD). 6 litters for E11.5, 6 litters for E12.5, 3 litters for E14.5, 11 litters for E17.5, 3 litters for E18.5, and 14 litters for PN0 are presented. (E) Body weight of +/ΔH19 neonates (mean ± SD). Three litters are presented. (D and E) Each data point represents an average weight of each genotype from one litter. Paired Student’s t-test; *p<0.05, **p<0.01, ***p<0.001, ****p<0.0001, and ns = not significant.
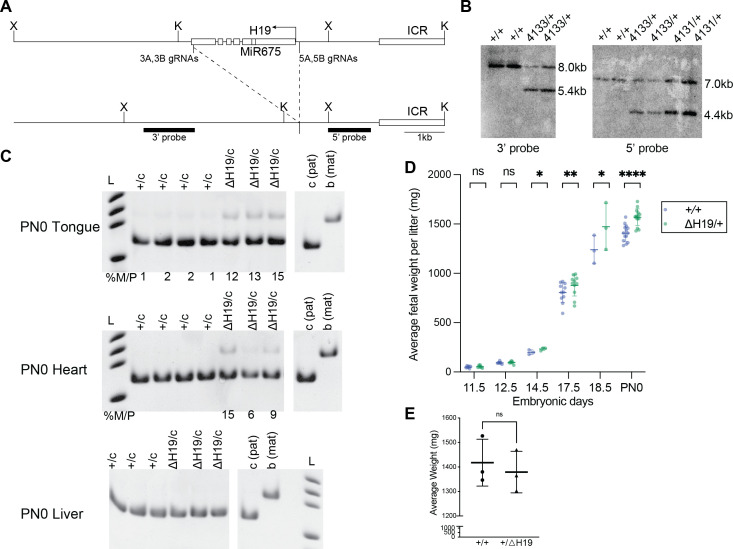
Figure 4—figure supplement 1—source data 1. Raw gel images for Figure 4—figure supplement 1B.
Figure 4—figure supplement 1—source data 2. Raw gel images for Figure 4—figure supplement 1C.
Figure 4—figure supplement 1—source data 3. Raw gel images for Figure 4—figure supplement 1C.
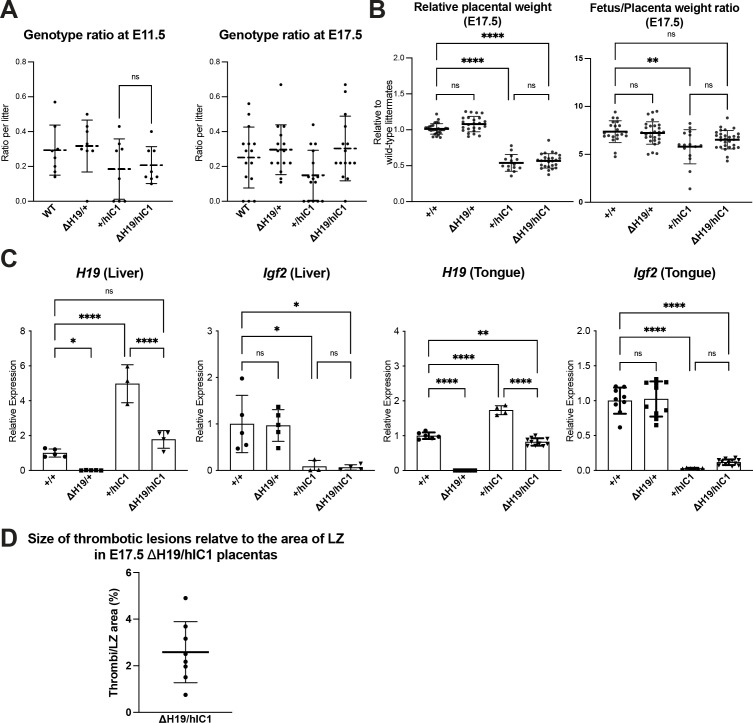
Figure 4—figure supplement 2. Supplementary data for rescue upon maternal ΔH19 transmission.

Figure 4—figure supplement 2.

(A) Ratio of wild-type, ΔH19/+, +/hIC1, and ΔH19/hIC1 embryos observed in E11.5 and E17.5 litters (>5 pups; mean ± SD). Each data point represents one litter. (B) Left: Relative placental weights of E17.5 wild-type, ΔH19/+, +/hIC1, and ΔH19/hIC1 samples, normalized to the average placental weight of the wild-type littermates (mean ± SD). Right: Fetal to placental weight ratio in E17.5 wild-type, ΔH19/+, +/hIC1, and ΔH19/hIC1 samples (mean ± SD). (C) Relative total expression of H19 and Igf2 in E17.5 wild-type, ΔH19/+, +/hIC1, and ΔH19/hIC1 liver and tongue samples (mean ± SD). (D) % Area of thrombotic clots in ΔH19/hIC1 placentas relative to labyrinth zone. (B and C) Each data point represents an individual conceptus from different litters. Statistics used are (A) paired Student’s t-test and (B and C) one-way ANOVA with Tukey’s multiple comparisons test; *p<0.05, **p<0.01, ***p<0.001, ****p<0.0001, and ns = not significant.