. 2022 Nov 28;11:e78754. doi: 10.7554/eLife.78754

Figure 6. Transcriptomic analysis of E12.5 cardiac endothelial cells from wild-type and mutant embryos.

(A) A gradient H19 and Igf2 expression levels are depicted in E12.5 wild-type, +/hIC1, △H19/+, △H19/hIC1, △3.8/+, and △3.8/hIC1 cardiac endothelial cells. M: male and F: female. (B) Left: Comparison between +/hIC1 and the wild-type samples with a volcano plot shows 224 differentially expressed genes (DEGs) between +/hIC1 and the wild-type samples. Right: Gene ontology (GO) pathways that are enriched for the 224 DEGs. (C) Immunofluorescence staining for MF20 (red) and collagen (green) on E17.5 wild-type and +/hIC1 hearts. Images on the right are enlarged from the boxed area of images on the left. Scale bars = 100 µm. (D) Expression pattern of 25 genes that are differentially expressed in both male and female +/hIC1 samples is compared to wild-type. (E) A volcano plot represents two DEGs between △3.8/hIC1 and the wild-type samples. (F) Expression pattern of 116 genes that are commonly differentially expressed in +/hIC1 compared to the wild-type and △3.8/hIC1 samples.

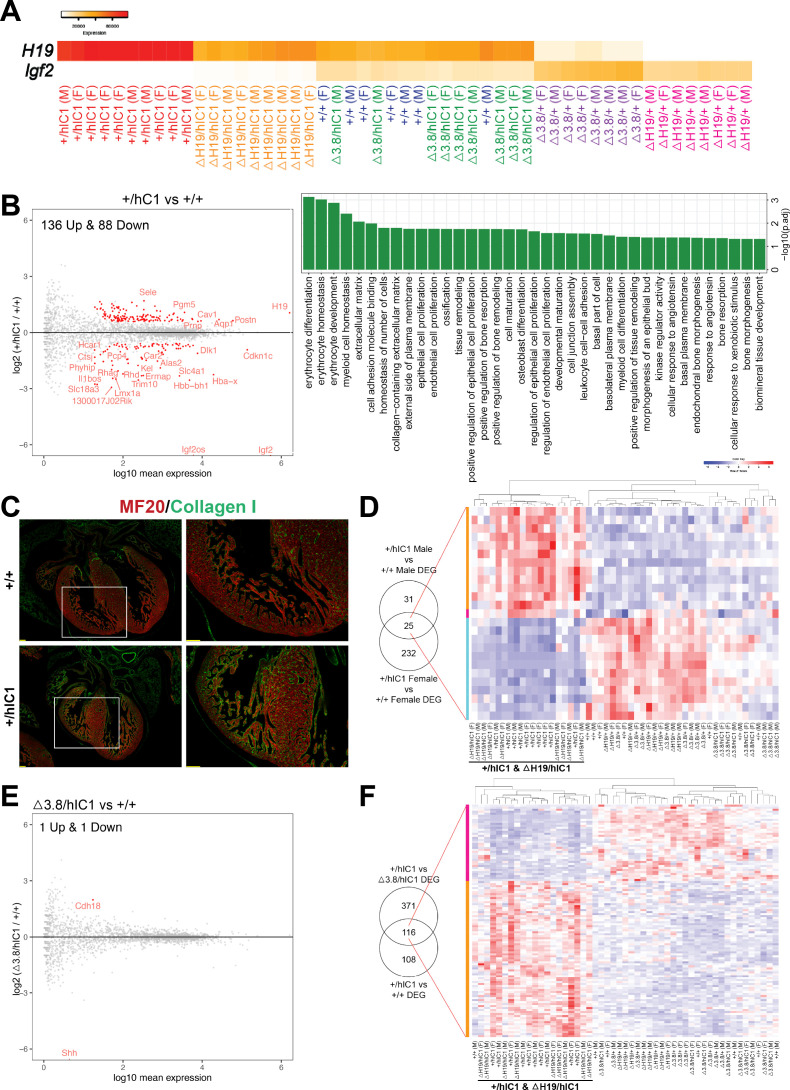
Figure 6.

Figure 6—figure supplement 1. Supplementary data for differential gene expression of +/hIC1 hearts.

Figure 6—figure supplement 1.

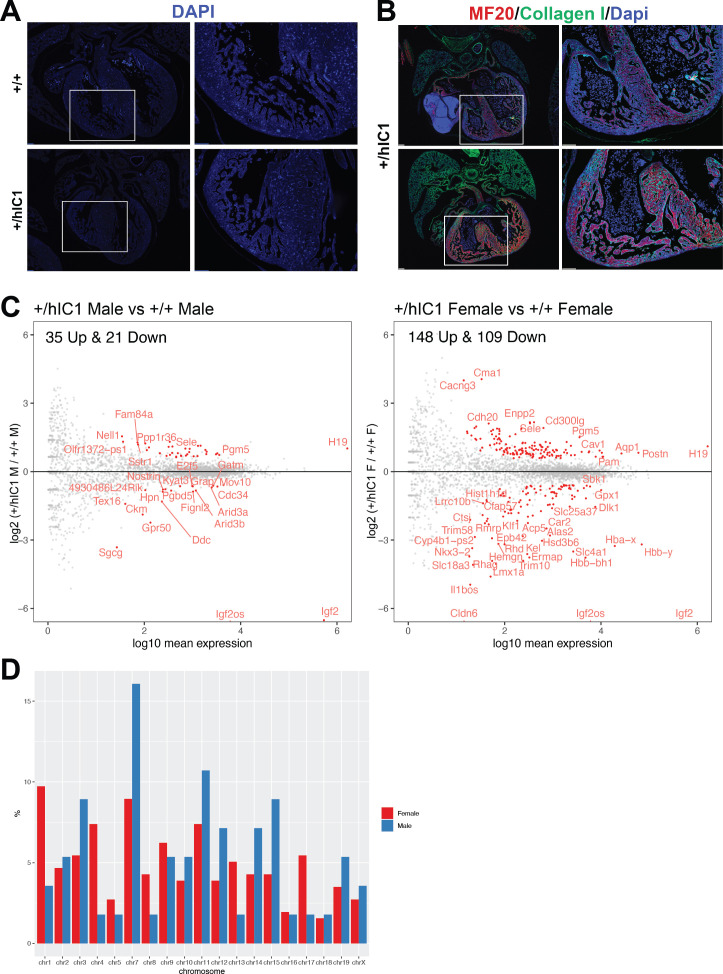
(A) DAPI (4′,6-diamidino-2-phenylindole; blue) on E17.5 wild-type and +/hIC1 hearts from Figure 6C. Images on the right are enlarged from the boxed area of images on the left. Scale bars = 100 µm. (B) Immunofluorescence staining for MF20 (red), collagen I (green), and DAPI (blue) on E17.5 +/hIC1 hearts. Images on the right are enlarged from the boxed area of images on the left. Scale bars = 100 µm. (C) Same-sex comparisons between +/hIC1 and the wild-type samples analyzed by RNA sequencing. (D) Chromosomal distribution of differentially expressed genes (DEGs) from comparisons between +/hIC1 and wild-type males and females.
Figure 6—figure supplement 2. Further RNA-seq analysis involving ΔH19/hIC1 endothelial cells.

Figure 6—figure supplement 2.

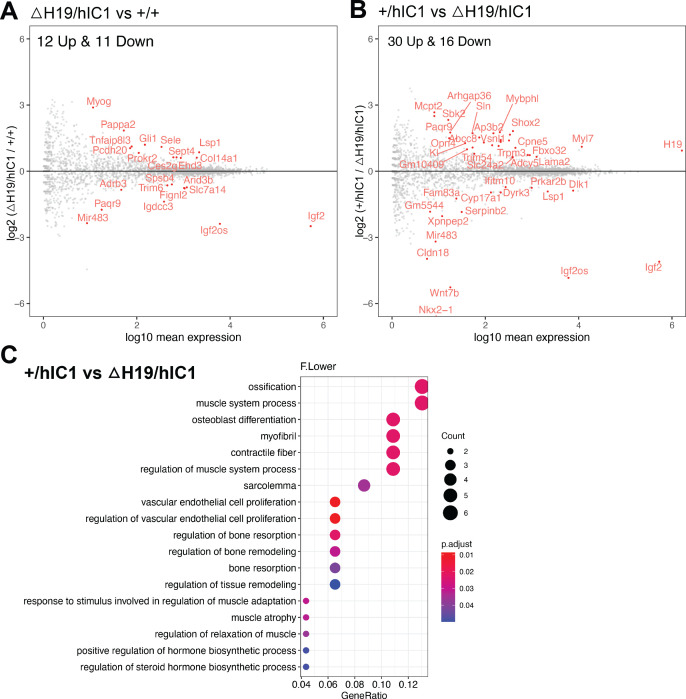
(A) Volcano plot depicting comparison of ΔH19/hIC1 and wild-type cardiac endothelial cells. (B) Volcano plot depicting comparison of +/hIC1 and ΔH19/hIC1 cardiac endothelial cells. (C) Gene ontology (GO) pathways that are enriched for 46 differentially expressed genes (DEGs) between +/hIC1 and ΔH19/hIC1 samples.
Figure 6—figure supplement 3. Enrichment tests for BRIDEAU_IMPRINTED_GENES using gene set enrichment analysis (GSEA).

Figure 6—figure supplement 3.

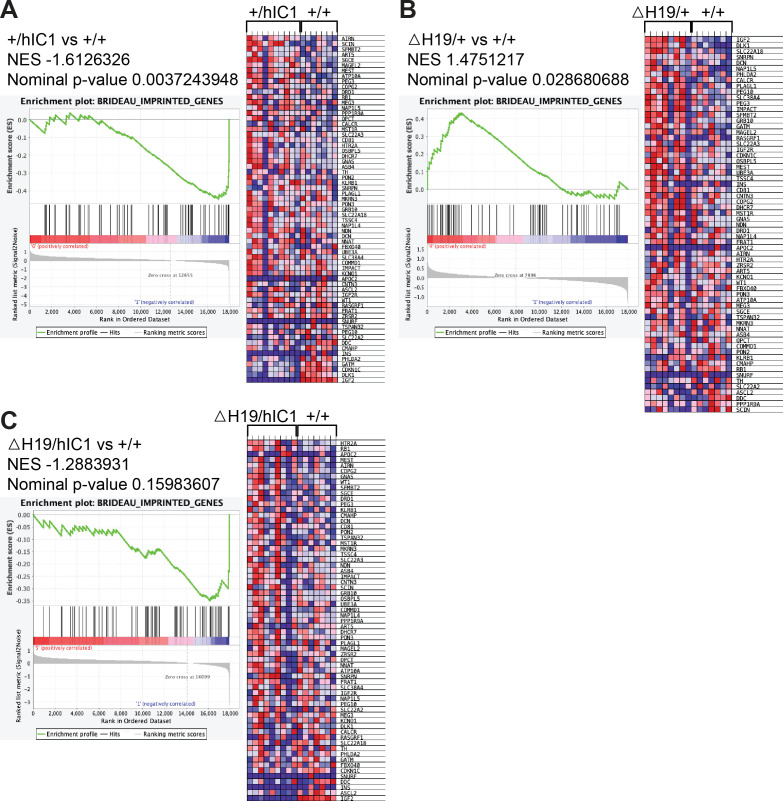
Normalized enrichment score (NES), nominal p-value, enrichment plot, and expression heatmap of the analyzed gene set comparing (A) +/hIC1 and wild-type, (B) ΔH19/+ and wild-type, (C) ΔH19/hIC1 and wild-type cardiac endothelial cells.
Figure 6—figure supplement 4. Further RNA-seq analysis utilizing Δ3.8/+ and Δ3.8/hIC1 endothelial cells.

Figure 6—figure supplement 4.

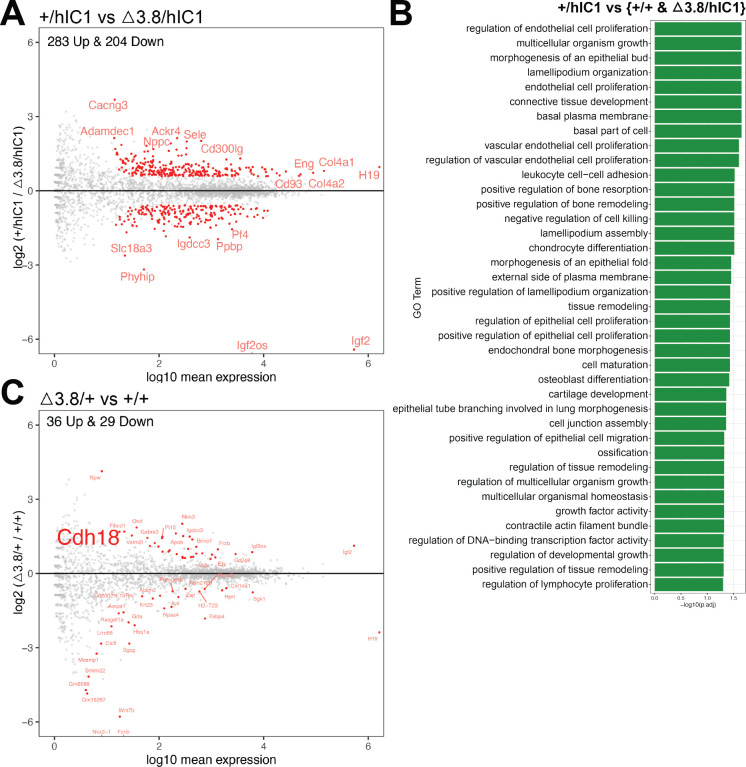
(A) Volcano plot depicting comparison of +/hIC1 and Δ3.8/hIC1 cardiac endothelial cells. (B) Gene ontology (GO) pathways that are enriched for 116 differentially expressed genes (DEGs) that are commonly differentially expressed in +/hIC1 compared to wild-type and Δ3.8/hIC1 samples. (C) Volcano plot depicting comparison of Δ3.8/+ and wild-type cardiac endothelial cells.
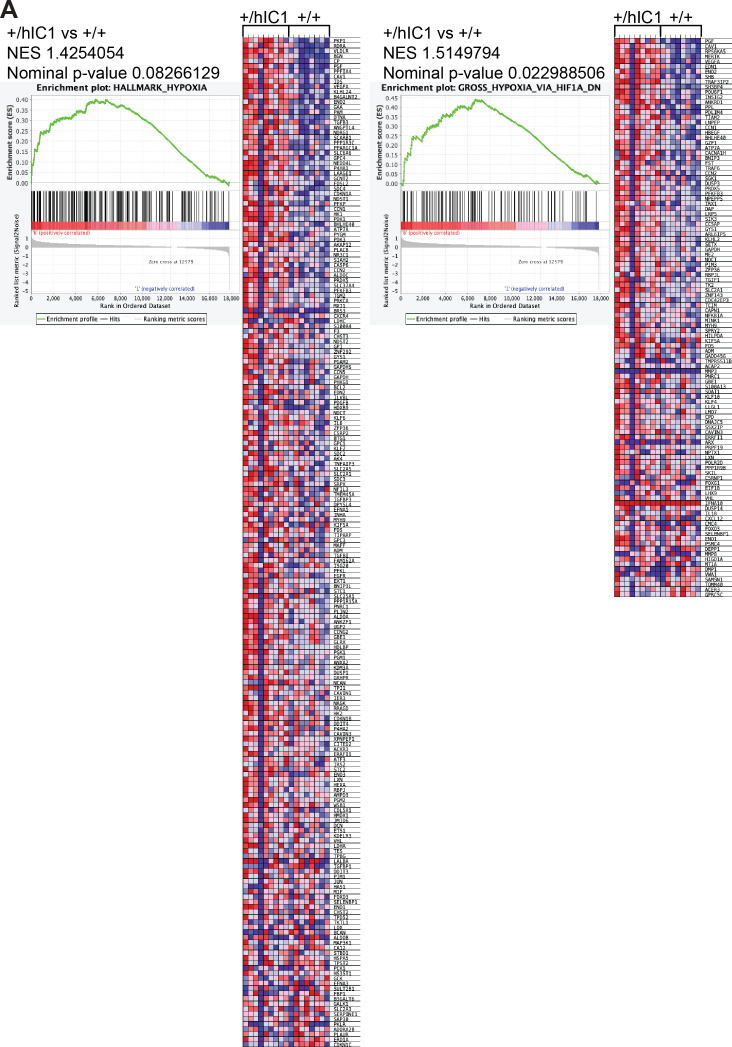
Figure 6—figure supplement 5. Enrichment tests for HALLMARK_HYPOXIA, GROSS_HYPOXIA_VIA_HIF1A_DN using gene set enrichment analysis (GSEA).

Figure 6—figure supplement 5.

Normalized enrichment score (NES), nominal p-value, enrichment plot, and expression heatmap of the (A) HALLMARK_HYPOXIA, (B) GROSS_HYPOXIA_VIA_HIF1A_DN gene set comparing +/hIC1 and wild-type cardiac endothelial cells.