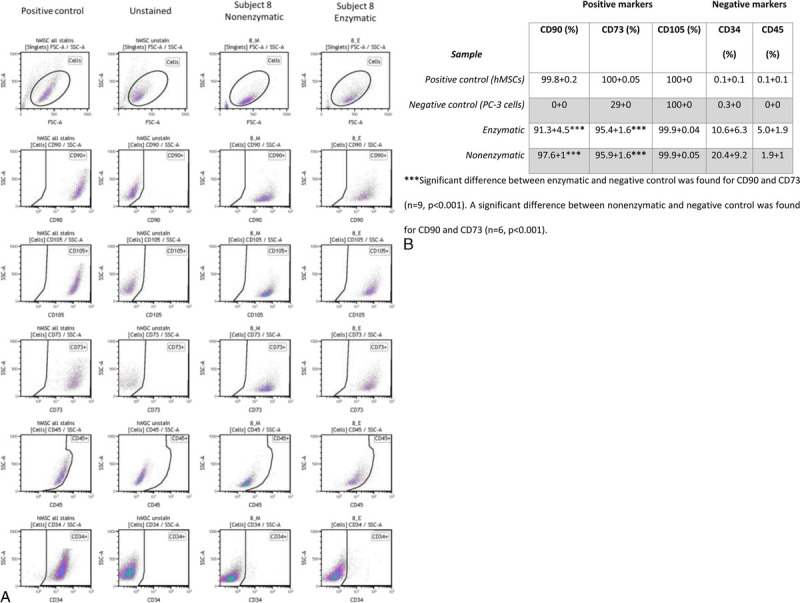
FIGURE 5.

FACS analysis of ASCs. A, Expression of surface stem cell markers, positive (CD90, CD73, and CD105) and negative (CD34 and CD45) detected by flow cytometric analysis of cultured ASCs. Data show a representative set of dot plot from subject 5 compared with the positive control (hMSCs) and negative control (unstained hMSCs) (B, Summary of the immunophenotypic characteristics of ASCs. For the enzymatic processing method, data are representative of the analysis of 9 individuals, and for the nonenzymatic processing method, data are representative of the analysis of 6 individuals compared with the positive control (hMSCs) and negative control (PC-3 cells). ***Significant difference between enzymatic and negative control was found for CD90 and CD73 (n = 9, P < 0.001). A significant difference between nonenzymatic and negative control was found for CD90 and CD73 (n = 6, P < 0.001).
