Figure 1.
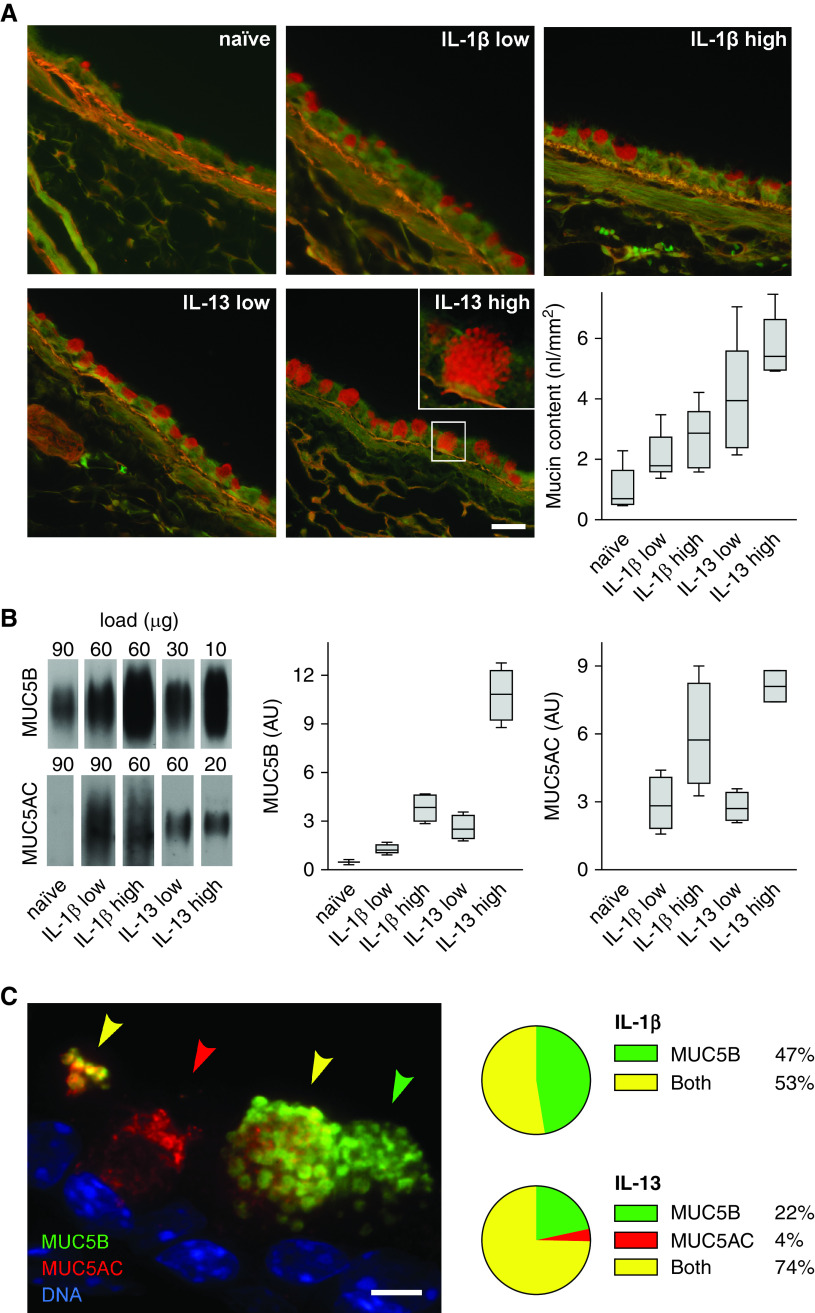
Mucin expression in mouse airways stimulated with cytokines. (A) Representative fields of periodic acid fluorescent Schiff (PAFS)-stained bronchial airways from naive (uninflamed) mice or mice stimulated with low or high doses of IL-1β or IL-13 to increase mucin production. Scale bars: main images, 25 μm; inset, 7 μm. Box plots show quantification of the intracellular mucin volume density (nl mucin/mm2 basement membrane) in the left axial bronchus (boxes show median and interquartile range, and whiskers show fifth and 95th percentiles; for IL-1β low vs. IL-13 low, P = 0.127; for IL-1β high vs. IL-13 high, P = 0.006; n = 5 mice per group). (B) Representative immunoblots of right lung lysates from the same mice as in A probed for MUC5AC (mucin 5AC, oligomeric gel-forming) and MUC5B (mucin 5B, oligomeric gel-forming). The total protein loaded for each sample was different to avoid saturation. Box plots show densitometric analyses of the immunoblots derived from standard curves for each probe (for MUC5B, IL-1β low vs. IL-13 low, P = 0.35; for MUC5B, IL-1β high vs. IL-13 high, P < 0.001; for MUC5AC, IL-1β low vs. IL-13 low, P = 0.99; for MUC5AC, IL-1β high vs. IL-13 high, P = 0.197; n = 5 mice per group). (C) Image of a mouse airway after a low dose of IL-13 and stained with antibodies against MUC5AC (red) and MUC5B (green). Arrowheads indicate secretory cells containing MUC5AC only (red), MUC5B only (green), or both mucins (yellow). Scale bar, 5 μm. Pie charts indicate fraction of mucin-containing cells in the axial bronchus that have MUC5AC only, MUC5B only, or both mucins after a low dose of IL-1β (618 cells, four mice) or IL-13 (808 cells, four mice). Statistical comparison is provided in Figure E1 for this and all subsequent pie charts except Figures 4C and E9. AU = arbitrary units.

