Figure 4.

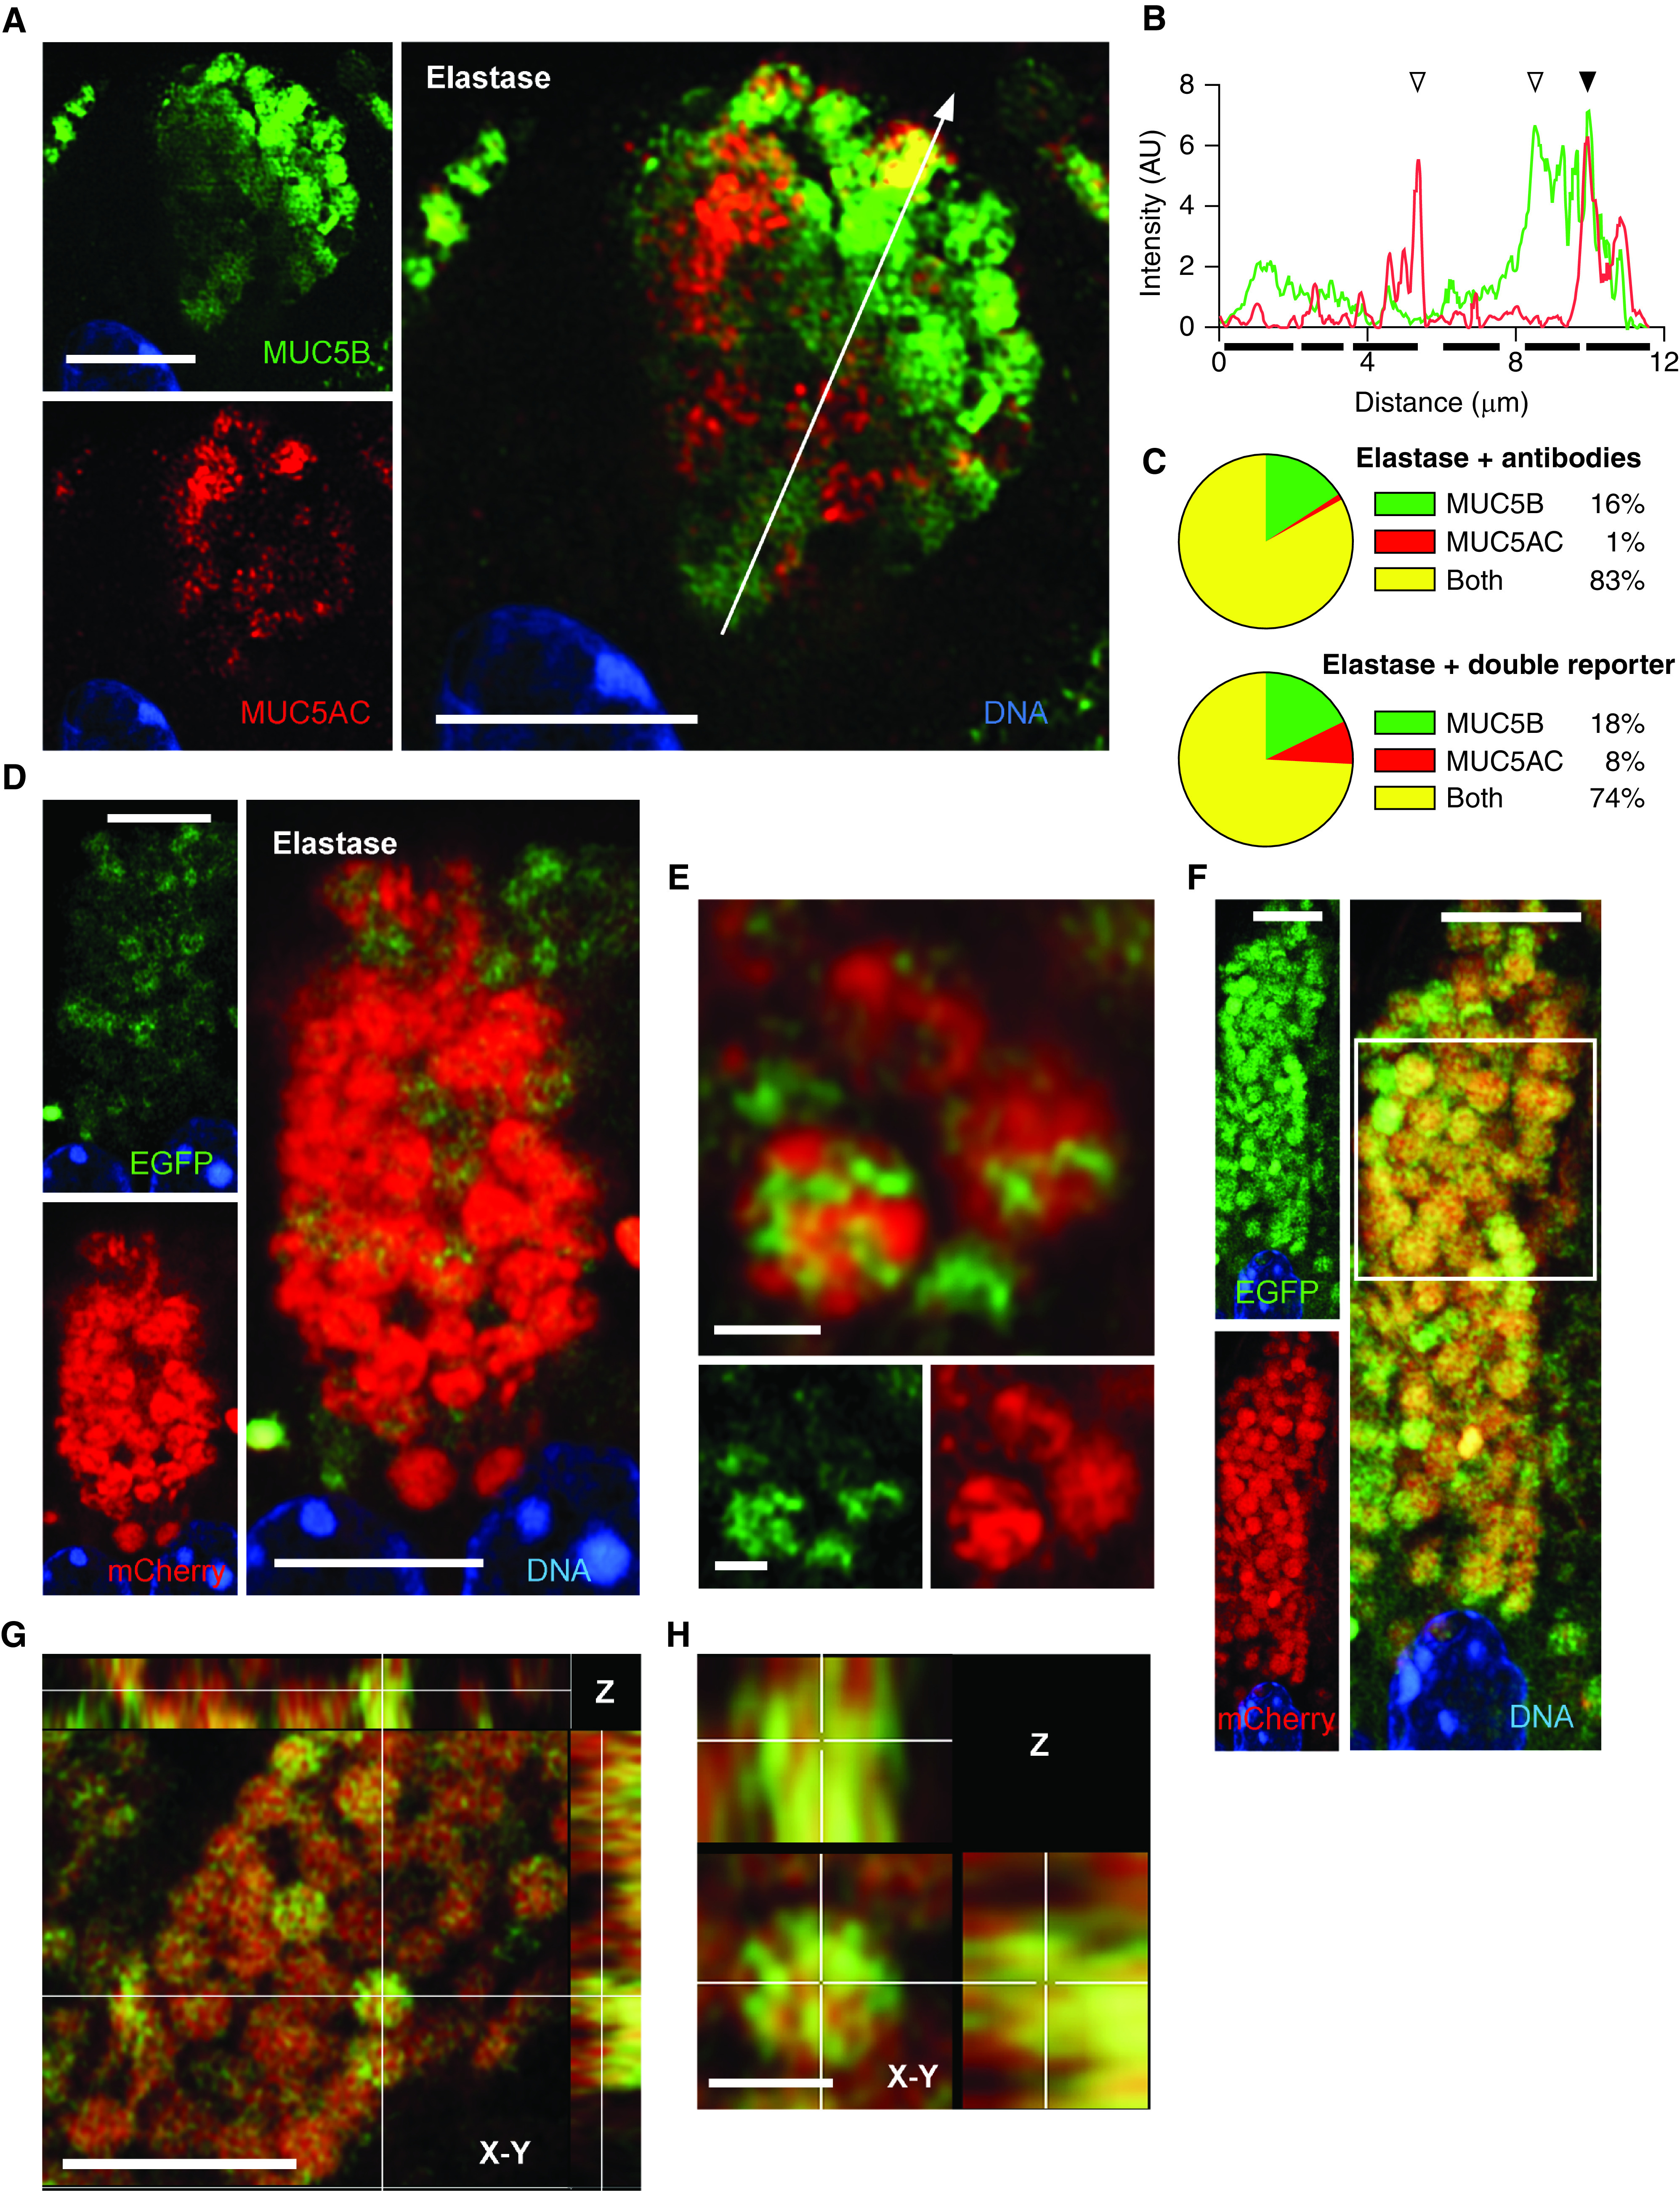
MUC5AC (mucin 5AC, oligomeric gel-forming) and MUC5B (mucin 5B, oligomeric gel-forming) colocalization in mouse airways stimulated with elastase. (A) Representative Airyscan image of a mouse airway secretory cell after elastase challenge and staining with antibodies against MUC5AC (red) and MUC5B (green). White line indicates the area of measured pixel intensities plotted in B. Scale bar, 5 μm. (B) Line-scan analysis of image in A is plotted as MUC5AC (red) and MUC5B (green) fluorescence intensity (y-axis) versus the length of the line (x-axis). Correspondence of the peaks for each line indicates colocalization of the mucins (solid triangles), whereas lack of correspondence indicates no colocalization (open triangles). Solid bars under the graph indicate individual granules. For additional examples, see Figure E4. (C) Populations of all granules counted in the line-scan analyses in samples stained with antibodies (top) or from reporter mice (bottom). Samples stained with antibodies: 440 granules, 44 cells, four mice; samples from reporter mice: 70 granules, seven cells, three mice; for samples stained with antibodies versus reporter mice, P < 0.001 by chi-square test. The complete data set of frequency distribution for granules imaged by immunofluorescence is shown in Figure E5. (D) Representative Airyscan image of an airway from a transgenic double-reporter mouse (EGFP-MUC5B/mCherry-MUC5AC) after elastase challenge. Scale bar, 5 μm. (E) High-magnification image of mucin granules from the same sample as D. Scale bars, 1 μm. (F) Another cell from a double-transgenic reporter mouse. White outline indicates area of higher magnification in G. Scale bar, 5 μm. (G) Higher magnification of the granules framed in F as well as the Z-plane reconstruction. Top panel, X-Z plane; right panel, Y-Z plane. Scale bar, 5 μm. (H) High magnification of a single granule from G showing X, Y, and Z planes. Scale bar, 1 μm. AU = arbitrary units; EGFP = enhanced green fluorescent protein.
