
Figure 2.
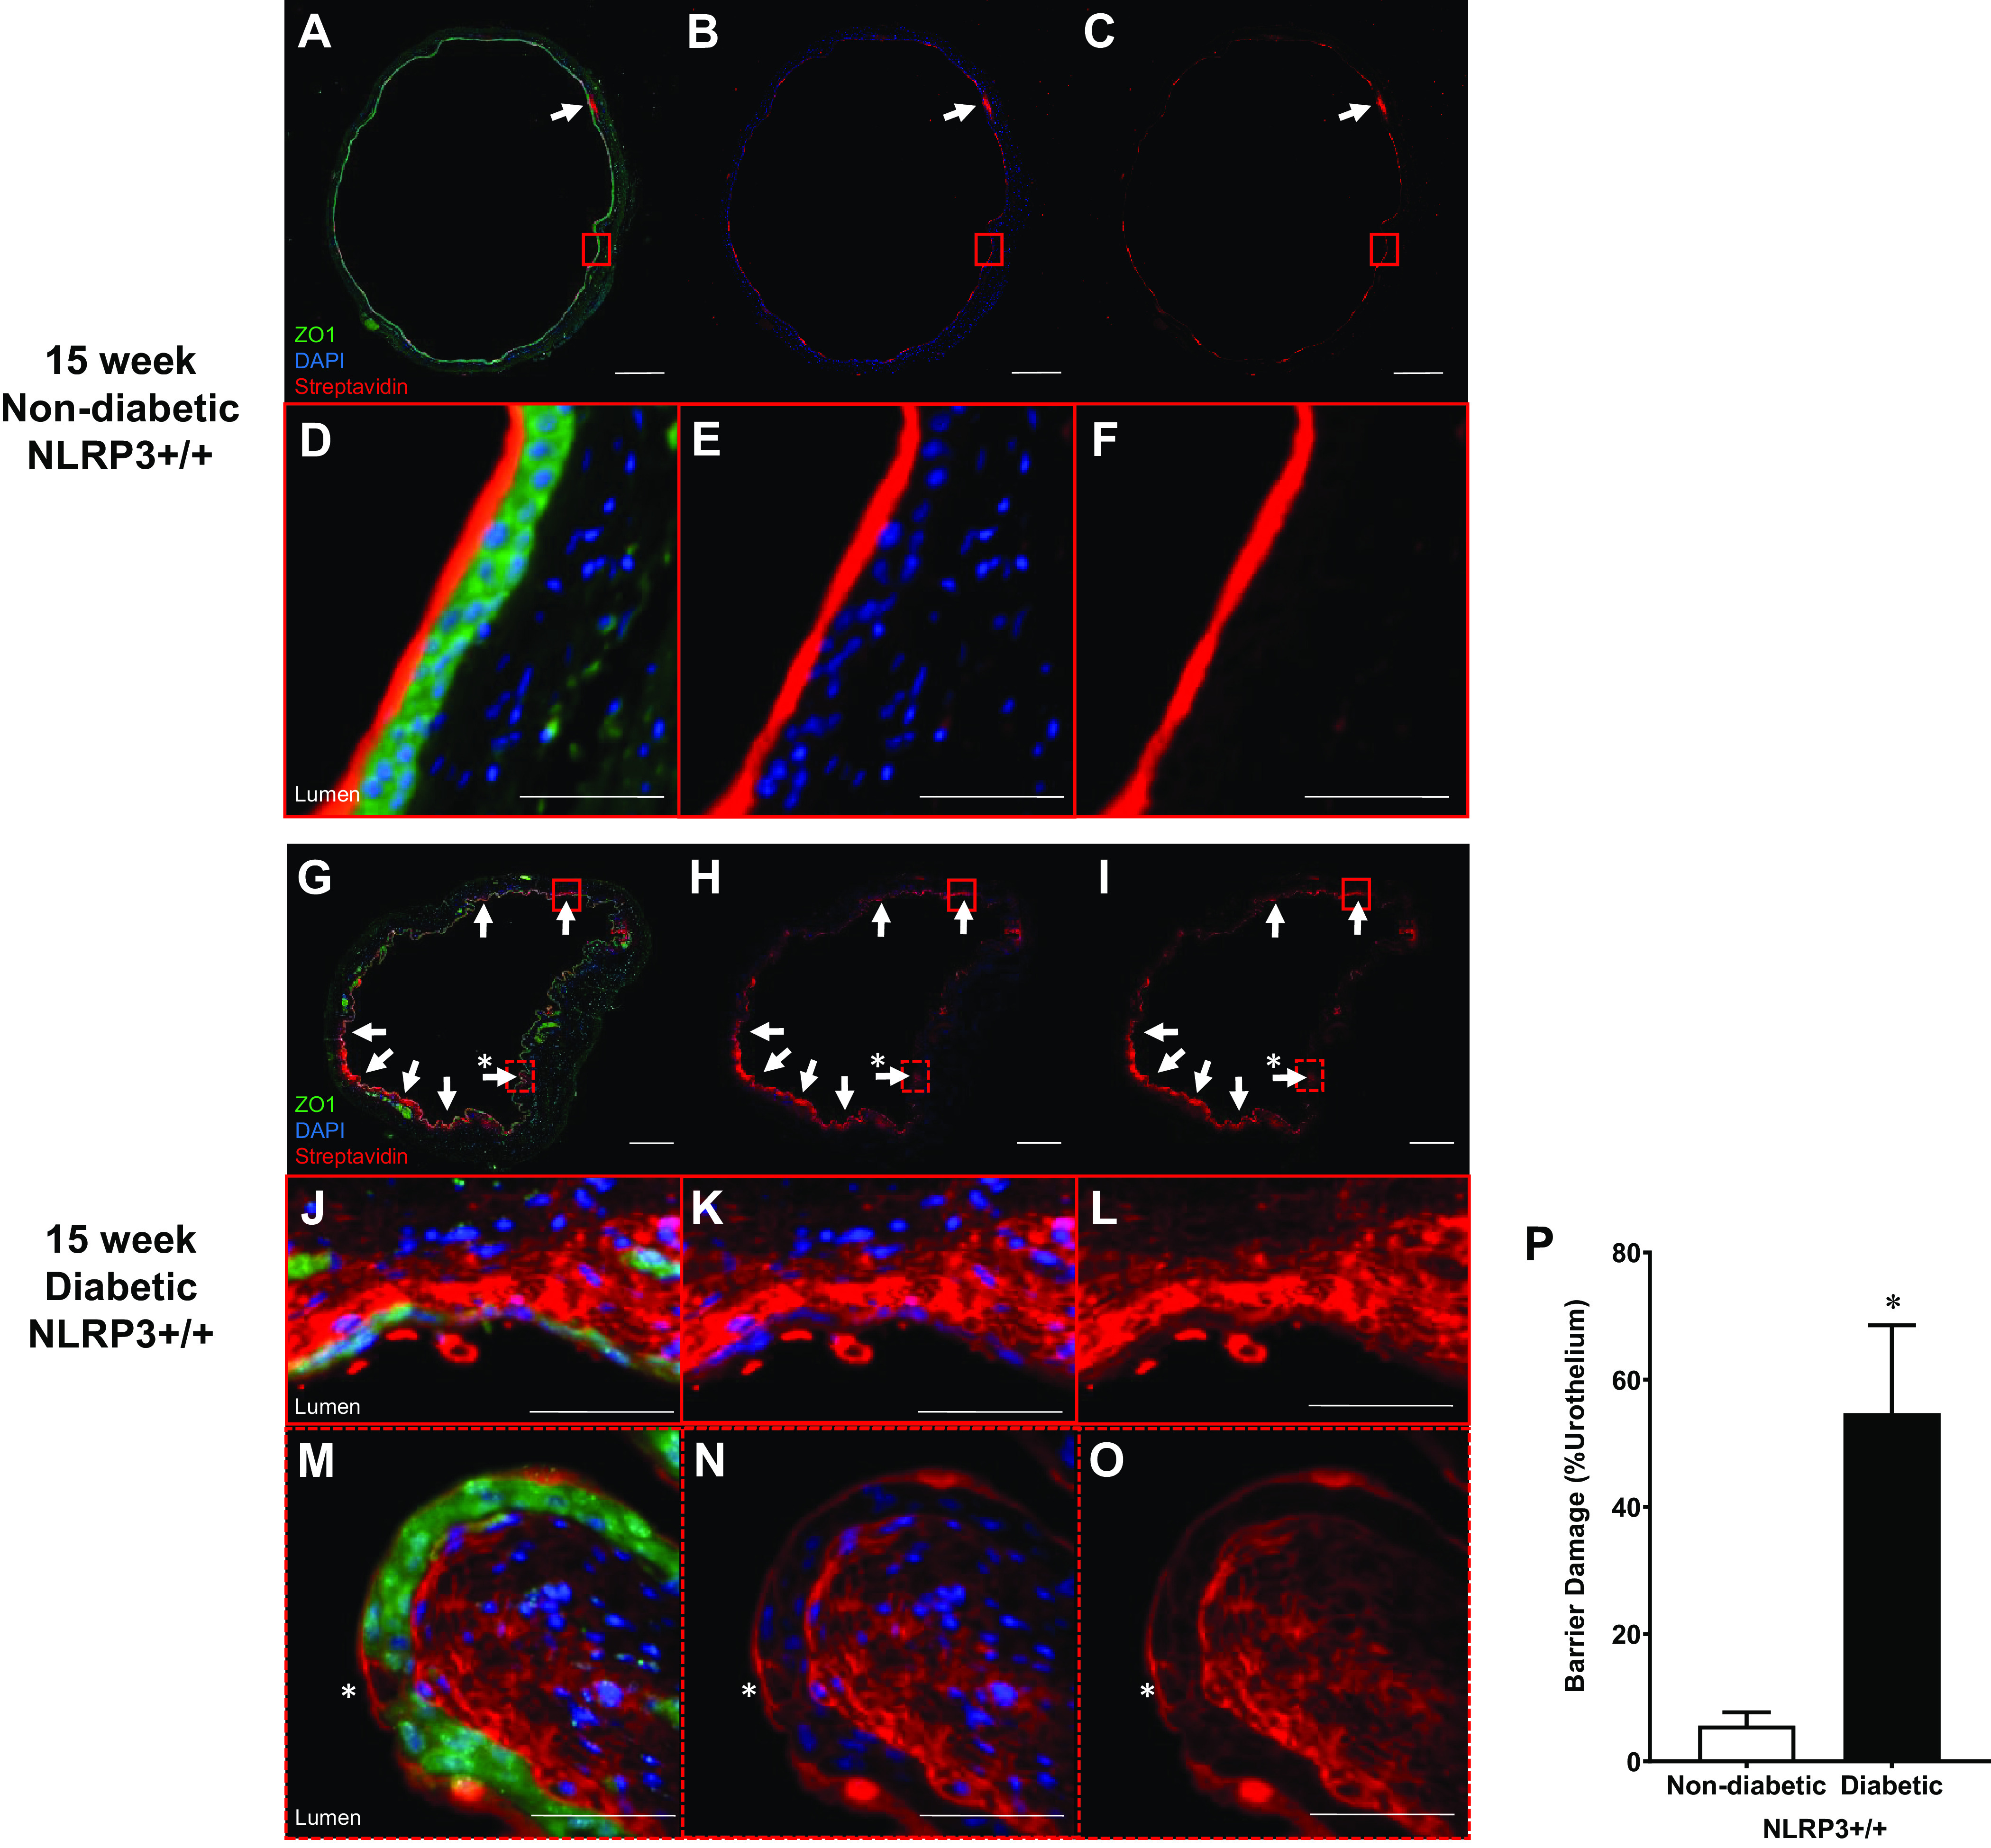
Diabetes increases in vivo urothelial permeability to sulfo-NHS-biotin at the 15-wk (overactive detrusor) time point. Sulfo-NHS-biotin was dissolved in PBS (1 mg/mL) and delivered intravesically (150 μL) through catheters placed in anesthetized mice. The sulfo-NHS-biotin solution was removed after 30 min and replaced with 150 μL of 4% paraformaldehyde. Bladders were tied proximal to ureters, excised, and paraformaldehyde fixed while inflated. Paraffin-embedded sections (5 µm) were then dehydrated and labeled with primary antibody to zona occludens 1 (ZO1) to identify urothelial cells (shown as bright green), Texas red-conjugated streptavidin for sulfo-NHS-biotin detection (red), and DAPI for nuclei (blue). Regions of urothelia (ZO1, green) considered damaged contained sulfo-NHS-biotin (streptavidin, red) in the submucosa. Representative images of bladder sections are shown. White scale bars = 500 μm. The red boxes indicate select representative regions, and the corresponding images are magnified views of these red boxes. Scale bars inside the red boxes = 50 μm. A: 15-wk nondiabetic NOD-, LRR-, and pyrin domain-containing protein 3 (NLRP3)+/+ urothelial barriers were nearly fully intact with sulfo-NHS-biotin staining on the apical surface. Limited regions of damage in which sulfo-NHS-biotin has traversed the urothelia are indicated by white arrows. B and C: to better visualize sulfo-NHS-biotin staining on the apical surface, the same slide is shown without the green ZO1 staining and blue DAPI staining. D–F: magnified micrographs of the area enclosed by the red boxes in A–C showing sulfo-NHS-biotin bound to the apical urothelial surface without any permeation into the submucosa. G–I: numerous patchy regions of sulfo-NHS-biotin were evident in the submucosa of 15-wk diabetic NLRP3+/+ mice. J–L: magnified micrographs of the area enclosed by the red boxes in G–I showing a region of desquamation with extensive submucosal penetration of sulfo-NHS-biotin evident in 15-wk diabetic NLRP3+/+ mice. M–O: magnification of the dashed red boxes in G–I identifying regions of single cell loss in the apical urothelia (*). This region contains sulfo-NHS-biotin staining and accumulation in the submucosa. P: at the 15-wk overactivity time point, over 50% of the urothelia from diabetic NLRP3+/+ mice was damaged compared with ∼5% damage in nondiabetic NLRP3+/+ mice. n = 4 and 5 animals, respectively. *P < 0.05 vs. nondiabetic NLRP3+/+ mice (Student’s t test).