Figure 3.

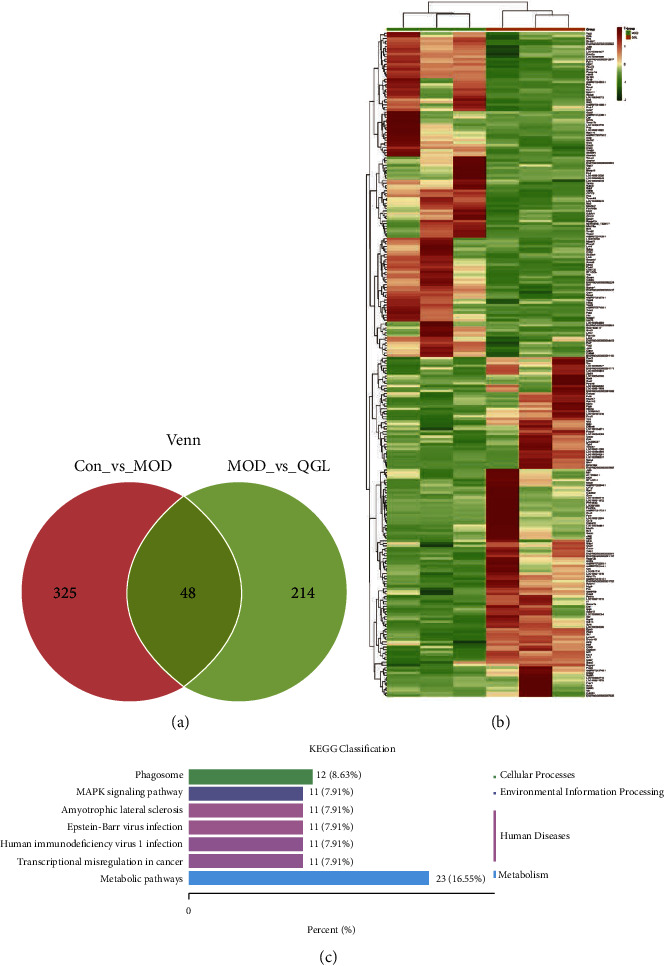
Transcriptomic data analysis (QGL vs MOD, n = 3). (a) Wayne figure of DEGs among groups. (b) The cluster heatmap of 262 DEGs between the QGL and MOD groups. (c) The KEGG classification analysis of 262 DEGs between the QGL and MOD groups.

Transcriptomic data analysis (QGL vs MOD, n = 3). (a) Wayne figure of DEGs among groups. (b) The cluster heatmap of 262 DEGs between the QGL and MOD groups. (c) The KEGG classification analysis of 262 DEGs between the QGL and MOD groups.