Figure 1.

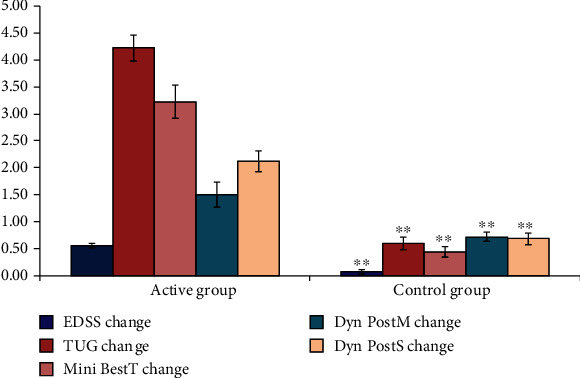
Comparison between active and control as regards to all studied variables. SD: standard deviation; ∗P < 0.05 between group comparison; ∗∗P < 0.01.

Comparison between active and control as regards to all studied variables. SD: standard deviation; ∗P < 0.05 between group comparison; ∗∗P < 0.01.