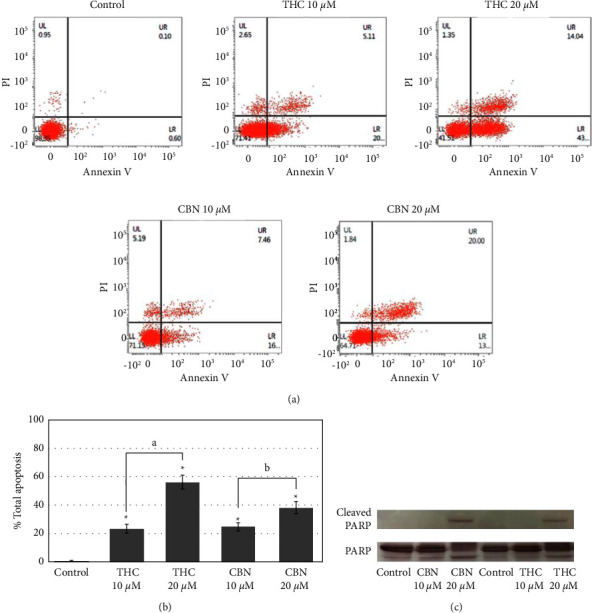
Figure 4.

THC and CBN induced apoptosis in CCA (HuCCT1) cells. (a) Flow cytometry results show the percentage of live, apoptotic, and necrotic cells in HuCCT1 cells after 18 h incubation as indicated. (b) Flow cytometry analysis demonstrates that at concentrations of 10 μM–20 μM, both THC and CBN showed significantly increased apoptotic cells compared to the control (∗P < 0.001 versus the control cells; aP < 0.001, 10 μM THC versus 20 μM THC; bP=0.002, 10 μM CBN versus 20 μM CBN). (c) Cleaved PARP in HuCCT1 cells after treatment with 10 μM–20 μM of THC or CBN for 18 h was determined by western blotting. At a concentration of 20 μM, THC and CBN induced cleaved PARP in HuCCT1 cells. PARP was used as a loading control.
