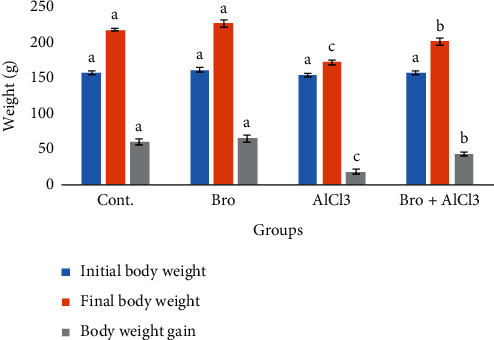
Figure 1.

Initial and final body weights and body weight gain in rats of different experimental groups. Values are expressed as means ± SEM; n = 7 for each treatment group. A significant difference between the groups was shown with different superscript letters (a, b, and c), P < 0.05.
