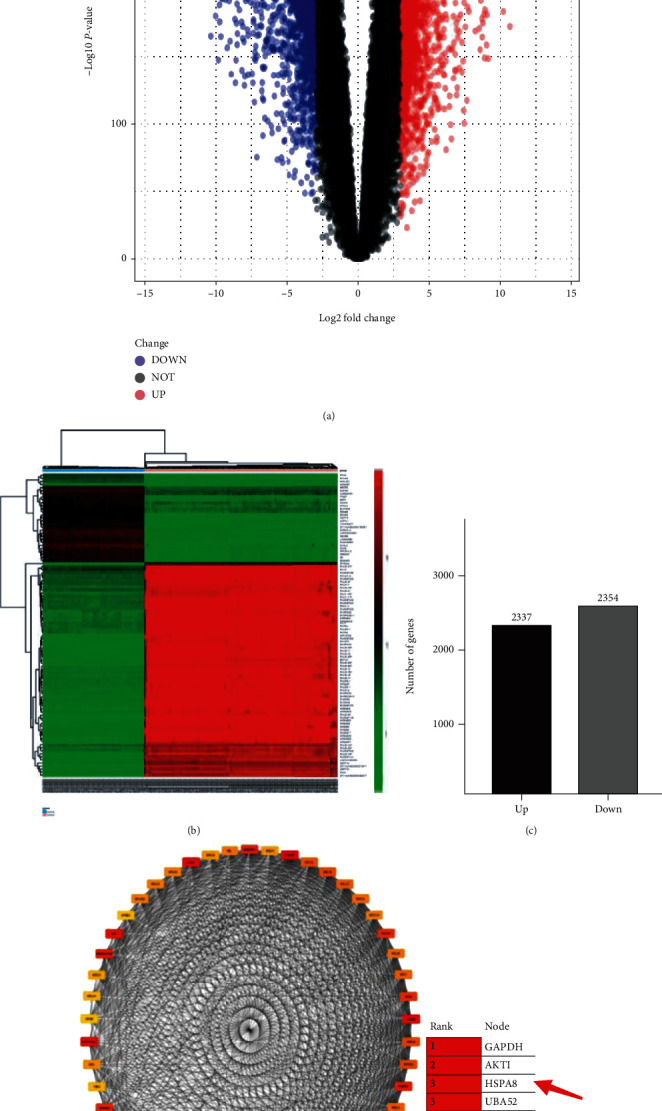
Figure 2.

Visualization of differentially expressed genes. (a) Described 4691 DEGs ( |log2FC| > 3 and P < 0.01). (b) The top 100 up- and downregulated DEGs in TNBC and normal breast specimen. (c) The number of DEGs. (d) Top 50 hub genes (by CytoHubba).
