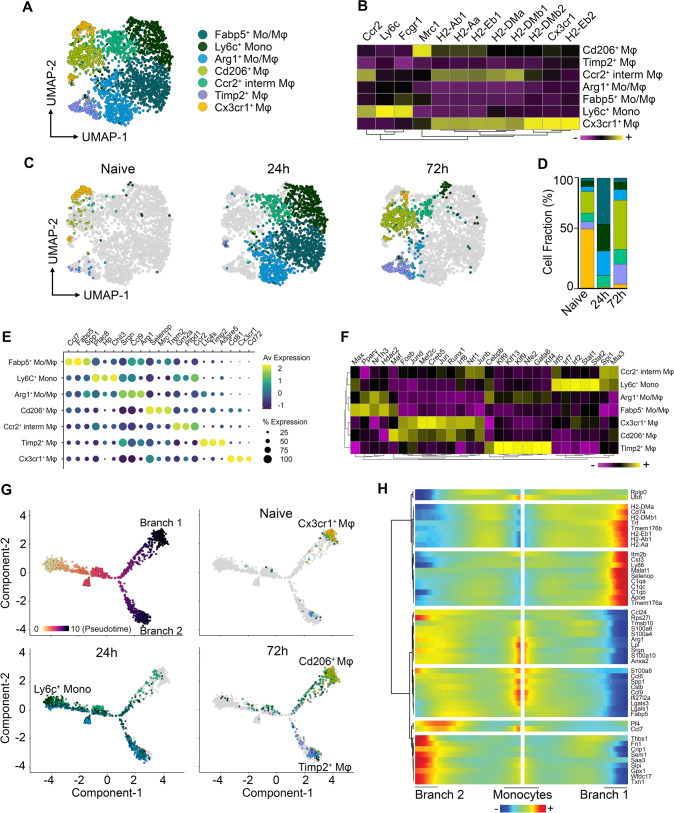
Fig. 2. Two main anti-inflammatory Mφ subpopulations with a unique transcriptional state are present during the resolution of muscularis inflammation.
a UMAP of reclustered monocyte/Mφ subpopulations from Fig. 1a from the healthy muscularis, 24 h and 72 h post-injury from WT mice. b Heatmap of typical monocyte and Mφ markers including MHCII genes. c UMAPs of time-dependent infiltration of monocyte and Mφ subsets upon muscularis inflammation. d Cell fraction of each subcluster relative to the total number of monocytes/Mφs at different time points after muscularis inflammation. e Dotplot showing expression of selected differentially expressed genes in each subcluster. f Heatmap of regulon activity per cluster according to SCENIC analysis. g Pseudotime analysis of monocytes/Mφs at different time points after muscularis inflammation. h Heatmap of gene expression showing the top 50 genes of different branches of the pseudotime trajectory tree.

