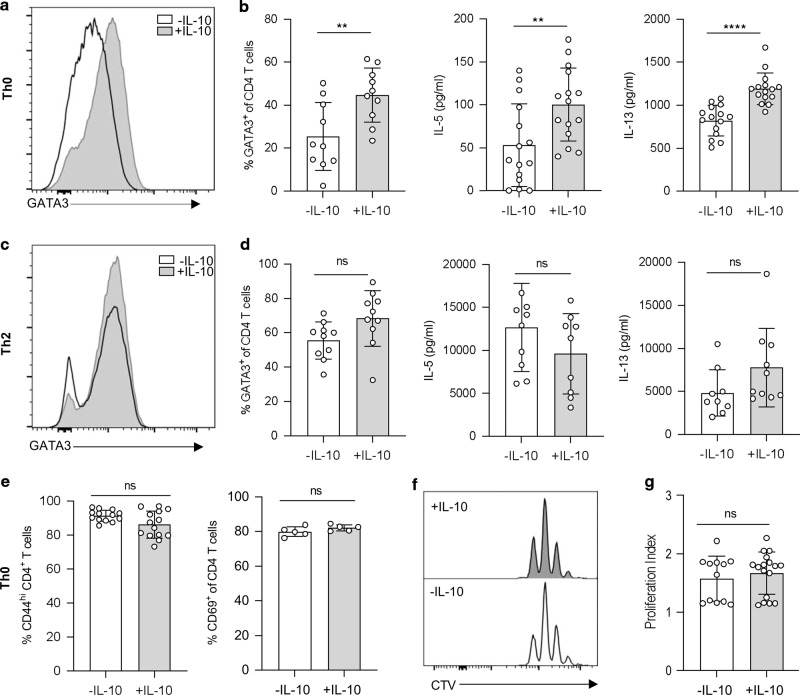
Fig. 2. IL-10 enhances Th2 differentiation independently of activation and proliferation.
In vitro polarised Th0 and Th2 cells were cultured with αCD3, αCD28 and IL-2 for 4 days with or without IL-10. a Representative histogram of GATA3 staining from IL-10 stimulated and unstimulated Th0 cells. b Percentage of CD4+ GATA3+ CD4 T cells (left) and concentration (pg/ml) of IL-5 (middle) and IL-13 (right) in Th0 culture supernatants. c Representative histogram of GATA3 staining from IL-10 stimulated and unstimulated Th2 cells. d Percentage of CD4+ GATA3+ T cells (left) and concentration (pg/ml) of IL-5 (middle) and IL-13 (right) in Th2 culture supernatants. e Percentage of CD44hi (left) and CD69+ (right) CD4 T cells from IL-10 stimulated and unstimulated Th0 cultures. f Representative histograms of Cell Trace Violet staining from IL-10 stimulated (top) and unstimulated (bottom) Th0 cultures. g Proliferation index of IL-10 stimulated and unstimulated Th0 cultures. Graphed data are shown with mean ± 1 SD and are pooled from three independent experiments with n = 4–5 per experiment. Statistical significance was calculated by Student’s t test where data were normally distributed (b, d, e) and Mann–Whitney U test where data were not normally distributed (g). (Significance **p < 0.01, ****p < 0.0001).

