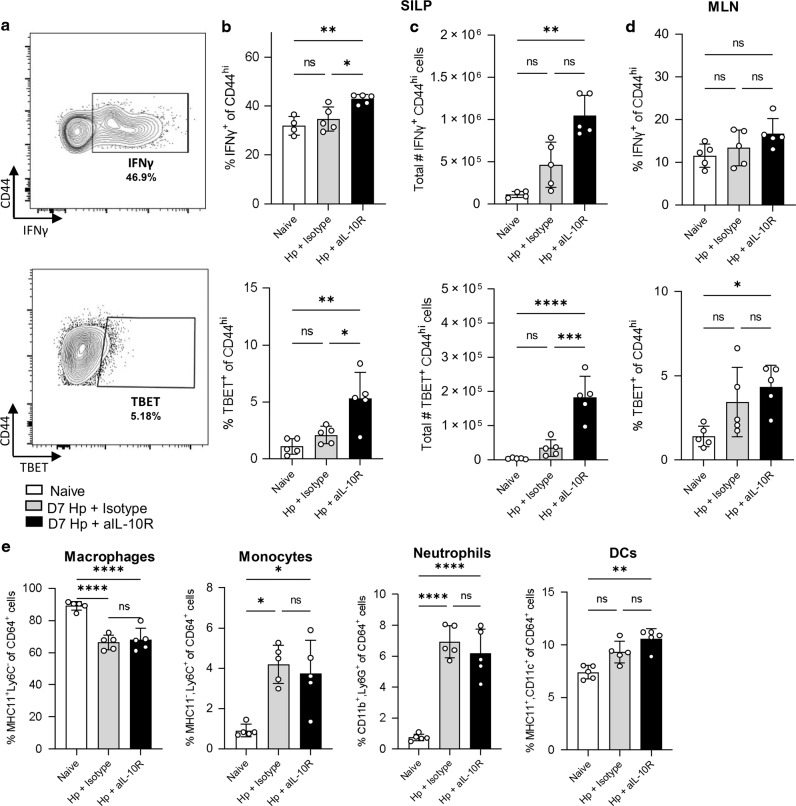
Fig. 5. IL-10 signalling blockade in H. polygyrus infection leads to expansion of Th1 cells in the small intestine.
C57BL/6 mice were infected with 200 L3 H. polygyrus and, at D-1, D2 and D5, treated with anti-IL-10R mAb or a matched isotype control. Seven days post-infection the small intestine and MLN were collected for analysis. a Representative flow cytometry plot of IFNγ (top) and TBET (bottom) staining. b Percentage of IFNγ+ (top) and TBET + (bottom) of CD44hi CD4+ T cells in the SILP. c Total number of IFNγ+ (top) and TBET+ (bottom) of CD44hi CD4+ T cells in the SILP. d Percentage of IFNγ+ (top) and TBET + (bottom) of CD44hi CD4+ T cells in the MLN. e Percentage of Macrophages (MHCII+ Ly6C−), Monocytes (MHCII− Ly6C+), Neutrophils (CD11b+ Ly6G+) and DCs (MHCII+ CD11c+) within the CD64+ population in the SILP. Graphed data are shown with mean ± 1 SD and are representative of 1–3 independent experiments with n = 4–5 per experiment. Statistical significance was calculated by ANOVA followed by a Tukey’s post-test for multiple comparisons between groups where data were normally distributed (b, c (TBET), d, e (macrophages and neutrophils)) and Kruskal–Wallis test with Dunn’s post-test for multiple comparisons between groups where data were not normally distributed (c (IFNγ), e (monocytes and DCs). (Significance *p < 0.05, **p < 0.01, ***p < 0.001, ****p < 0.0001).

