
Figure 5.
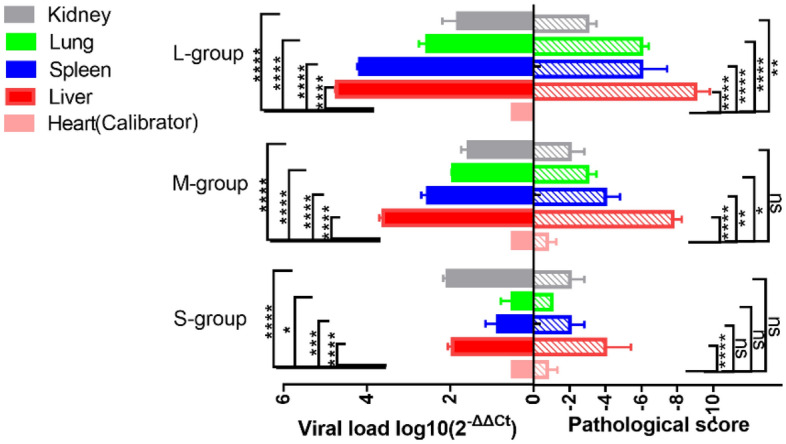
Column representation of visceral viral loads and a pathological scores of rabbits infected with GI.1. The viral load was calculated according to the formula 2−ΔΔCT. The higher the ΔCt value is, the lower the 2−ΔΔCT value is. The heart with the highest ΔCt value and the lowest expression of GI.1 was selected as Calibrator. Different asterisks indicate significant differences, *(p < 0.05), **(p < 0.01), ***(p < 0.001), ****(p < 0.0001); ns means the difference is not significant (p > 0.05).