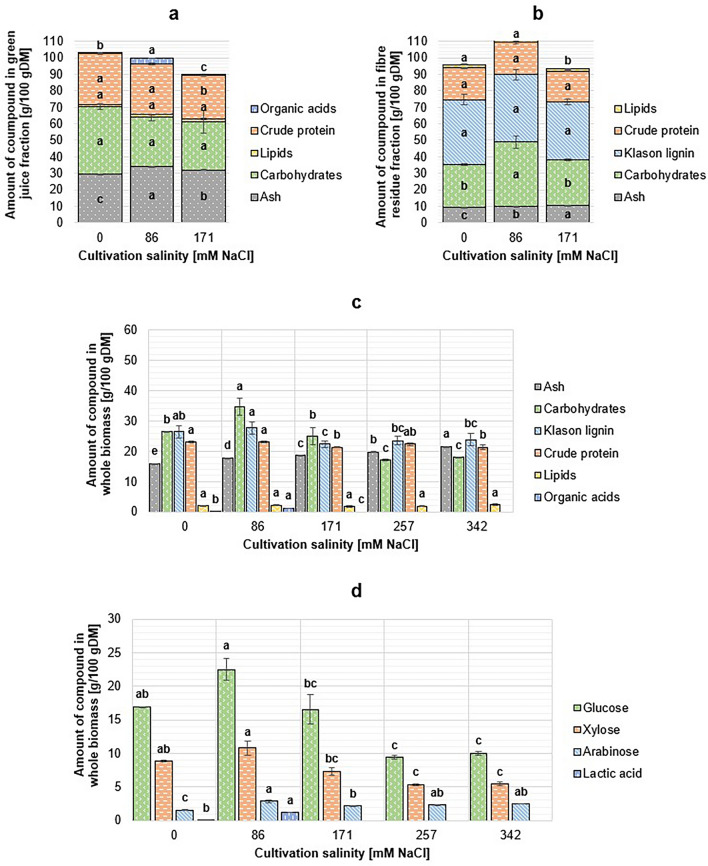
Figure 4.
Chemical composition of Crithmum maritimum green juice (a), fibre residue (b) and whole biomass (c), and total sugar profile (d). DM: dry matter. For 0, 86, and 171 mM NaCl salinity cultivated samples, the content of a compound in whole biomass was calculated from juice and fibre residue fractions. Only structural carbohydrates were analysed for samples cultivated in 257 and 342 mM NaCl. Due to the small concentration of organic acids (< 0.1 g/100 g DM), all bars are not visible in the graphs. Biomass samples which were not fractionated were not analysed for their contents of organic acids. Different letters above the bars denote significantly different (p < 0.05) results calculated individually for each biochemical group.

