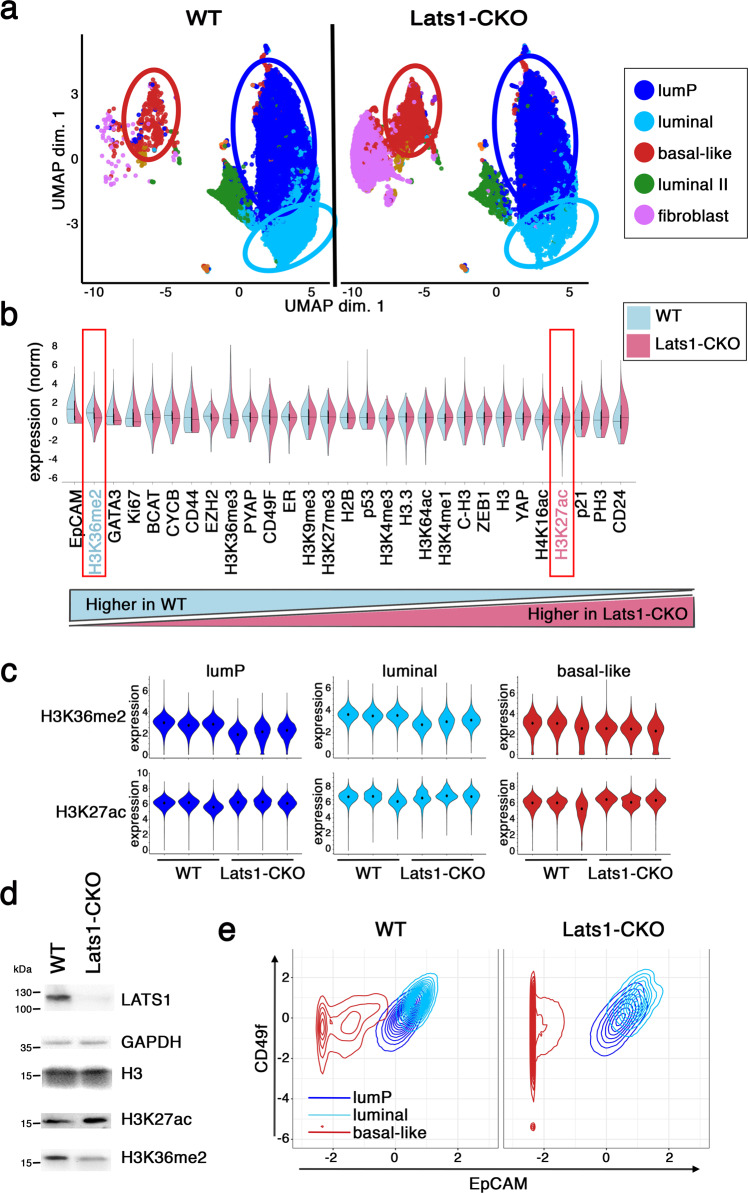
Fig. 1. Lats1 knockout promotes an epigenetically distinct basal-like population.
a Single cells derived from 3 WT (left panel) and 3 littermate-matched Lats1-CKO (right panel) PyMT-driven tumors were processed for EpiTOF analysis as described in the “Methods” section. Shown is a uniform manifold approximation and projection for dimension reduction (UMAP). Relevant populations are indicated by circles. LumP luminal progenitors. b Comparison of the relative levels of EpiTOF markers in the WT vs. Lats1-CKO EpiTOF-defined in vitro basal-like subpopulations. Expression of each of the markers was centered to zero mean and displayed as a split violin plot ordered by directionality and extent of the difference. Black lines designate medians. Red boxes denote H3K36me2 and H3K27ac. c Violin plot comparing mean expression levels of the indicated epigenetic marks in WT vs. Lats1-CKO PyMT cells in the three different subpopulations of the in vitro EpiTOF samples (defined in a). d Western blot analysis of H3K27ac and H3K36me2 in WT and Lats1-CKO in vitro samples. GAPDH served as a loading control. Total H3 levels are also shown. Representative blot of five biological repeats. e Bivariate contour plots showing the expression (Z-scores) of EpCAM and CD49f in WT vs. Lats1-CKO in vitro EpiTOF samples, within the indicated subpopulations.

