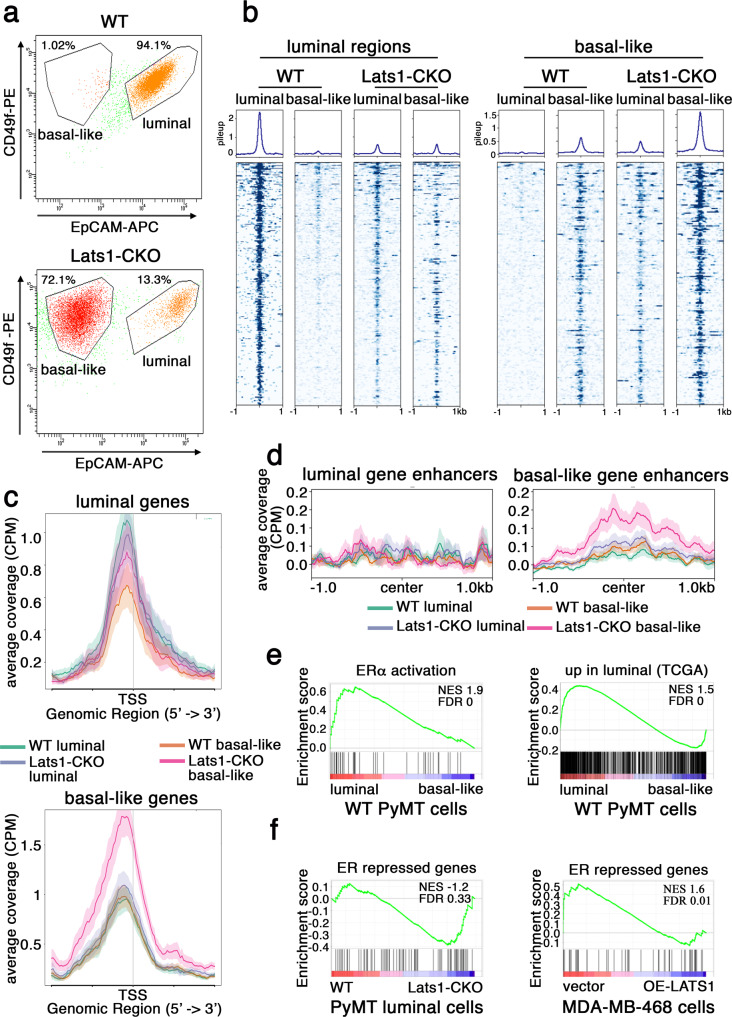
Fig. 2. Characterization of luminal and basal-like subpopulations.
a WT and Lats1-CKO PyMT-derived cell lines were FACS-sorted according to relative EpCAM and CD49f expression. Solid black lines demark luminal and basal-like subpopulations isolated for brief expansion in culture. b WT and Lats1-CKO FACS-enriched luminal and basal-like subpopulations were propagated to attain a minimum of 50,000 cells for analysis by ATAC-seq. Signals associated with WT luminal peaks (266 peaks, left) or WT basal-like peaks (212 peaks, right) are presented. Two biological replicates were analyzed to call differential peaks; one representative sample from each condition is depicted. c Cumulative ATAC-seq reads over TSS of genes differentially upregulated (RNA-seq analysis using DESeq2 FC > 1.5, raw p-value < 0.05) in luminal (top) or basal-like (bottom) cells, in the indicated subpopulations. Two biological replicates were analyzed and the resultant ATAC-seq BAM files were merged. Lines depict average coverage, shaded areas represent SE. d Comparison of cumulative ATAC-seq reads over enhancers associated with genes differentially upregulated (RNA-seq analysis using DESeq2 FC > 1.5, raw p-value < 0.05) in luminal (left, 92 enhancers) or basal-like (right, 374 enhancers) cells in WT and Lats1-CKO PyMT cells. Genes were associated with enhancers based on ENC+ EDP enhc-Gene dataset166. Merged coverage from replicates is shown. Lines depict average coverage, shaded areas represent SE. e Gene set enrichment analysis (GSEA) of WT luminal vs. WT basal-like differential gene expression compared with an ERα activated30 gene set (left) and with genes upregulated in human luminal tumors relative to basal-like tumors (TCGA) (right). f GSEA of PyMT WT vs. Lats1-CKO luminal (left) and MDA-MB-468 cells expressing vector control or LATS1 after 48 h of doxycycline induction (right), compared to an ER repressed30 gene set.

