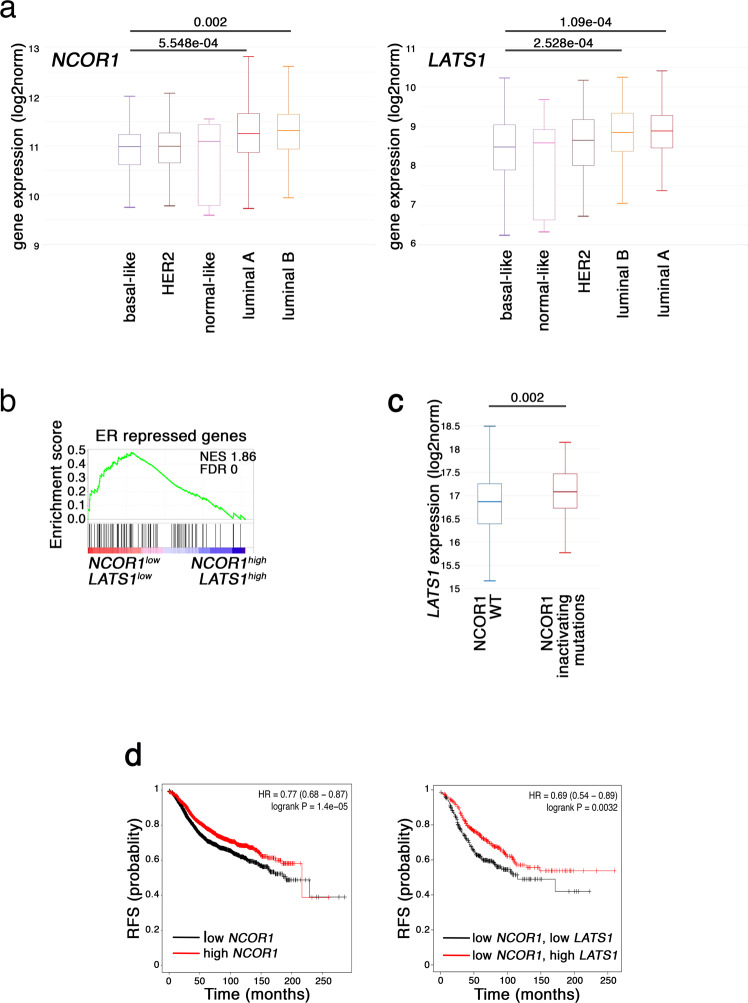
Fig. 7. LATS1 and NCOR1 exert similar effects on the expression of ER-repressed genes in human luminal breast cancer.
a Expression of NCOR1 (left) or LATS1 (right) in different breast cancer molecular subtypes. Expression (normalized log2(norm_count + 1)) was extracted from the TCGA-BRCA dataset and depicted using the XENA webtool (n = 522). One-way ANOVA and Tukey’s post hoc test were performed. Box plots show the center line as the median, box limits as upper and lower quartiles, and whiskers as minimum and maximum values. b GSEA analysis of genes upregulated (ranked according to FC) in breast cancers harboring low levels of NCOR1 and LATS1 (NCOR1lowLATS1low, bottom quartiles), compared to tumors with high levels of both genes (NCOR1highLATS1high, top quartiles), against a dataset of ER-repressed genes30. c LATS1 expression [log2(fpkm-uq + 1)] in breast cancer tumors (TCGA-BRCA) harboring WT NCOR1 (n = 919) or inactivating mutations in NCOR1 (n = 37). Inactivating mutations were evaluated using PolyPhen (https://www.ensembl.org/info/genome/variation/prediction/protein_function.html). Box plots as in (a). Unpaired two-tailed t-test was performed. d Kaplan–Meier plots (https://kmplot.com/analysis/) of relapse-free survival (RFS) of ER+ breast tumors associated with low vs high expression of NCOR1 (low, n = 1887; high, n = 1881) and/or LATS1 (low, n = 354; high, n = 353).

