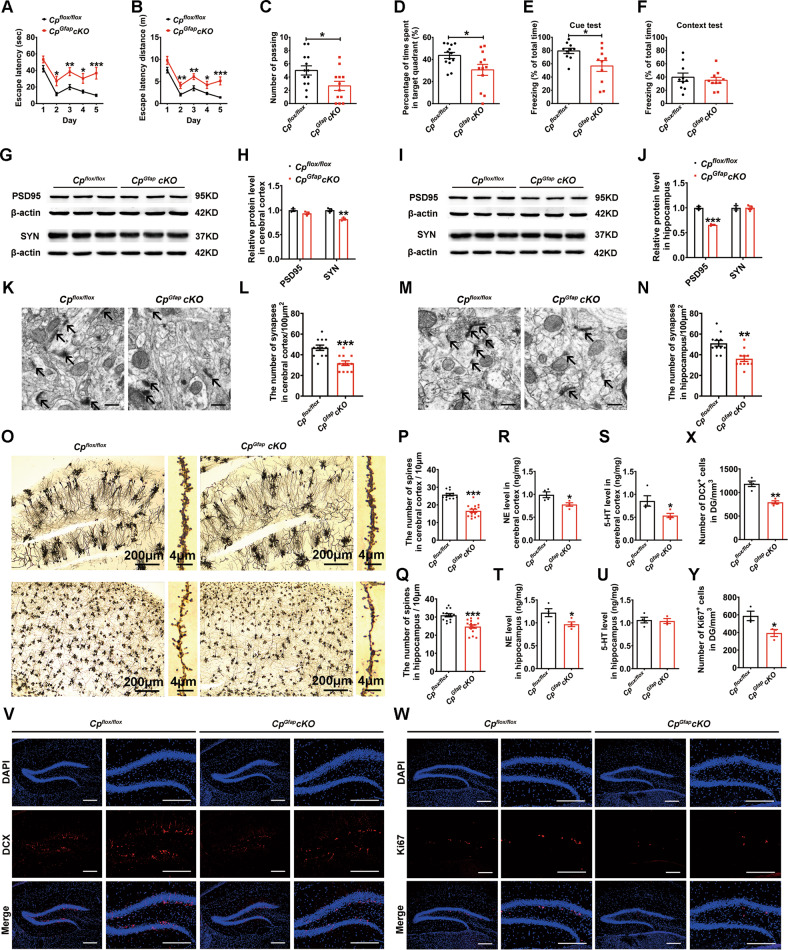
Fig. 1. Conditional knockout of Cp in murine astrocytes impaired cognitive function and synaptic plasticity in the cerebral cortex and hippocampus.
A-D MWM test of the Cpflox/flox and CpGfapcKO mice. The latency time (A) and distance (B) to find the platform were recorded during the training trials from the 1st day to the 5th day. The platform was visible above the water during the 1st and 2nd day while hidden during the 3rd to 5th day. After training trails, the number of times the mice passed the hidden platform area (C) and the percentage of target quadrant passing time were recorded (D) on the 6th day when the platform was removed and the mice were allowed to search for the area. (n = 13 for Cpflox/flox group, n = 12 for CpGfapcKO group). E-F Conditional Fear Memory was tested using cued (E) and contextual (F) fear conditioning, and the percentage of freezing time was recorded after training (n = 10). G-J SYN and PSD95 protein levels in the cerebral cortex (G) and hippocampus (I), as detected by western blot analysis. β-actin was used as an internal reference. Densitometric analysis of the quantity of SYN and PSD-95 levels in the cerebral cortex (H) and hippocampus (J) are shown in the chart. (n = 3). K-N Synaptic density was assessed in the cerebral cortex (K) and hippocampus (M) by TEM; quantification of the number of synapses per 100 μm2 from the cerebral cortex (L) and hippocampus (N) are shown in the chart (n = 12 fields from 3 mice in cerebral cortex per group; n = 11 fields from 3 mice in hippocampus per group) Scale bar: 500 nm. O-Q: Golgi staining of the structural dendrites of the hippocampus and cerebral cortex (O) and the number of spines in the cerebral cortex (P) and hippocampus (Q) (n = 12 fields from 4 mice for Cpflox/flox group and n = 14 fields from 4 mice for CpGfapcKO group in cerebral cortex; n = 13 fields from 4 mice for Cpflox/flox group and n = 15 fields from 4 mice for CpGfapcKO group in hippocampus) were quantified after Golgi staining. R-U: The relative 5-HT and NE concentrations in the cerebral cortex (R-S) and hippocampus (T-U) were measured by HPLC in Cpflox/flox and CpGfapcKO mice. The data are normalized to the levels in the control group (n = 4 per group in R-T; n = 4 for the Cpflox/flox group and n = 3 for the CpGfapcKO group in the chart (U). V-Y: Immunofluorescence staining of DCX (V) and Ki67 (W) in the DG of the hippocampus in Cpflox/flox and CpGfapcKO mice. Quantification of the number of the DCX- and Ki67-positive cells is presented in charts X (n = 4) and Y (n = 3); DAPI was used for nuclear staining. Scale bar: 200 μm. All the data are presented as the mean ± SEM; *p < 0.05; **p < 0.01; ***p < 0.001 vs. Cpflox/flox.

