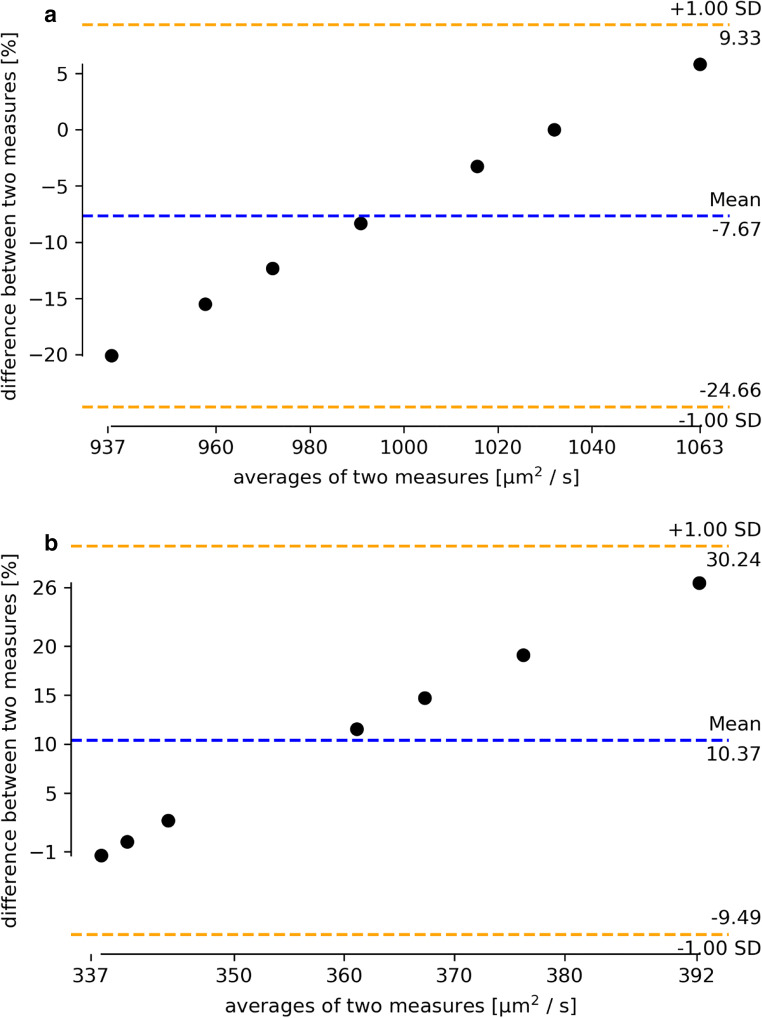
Fig. 4.
a Bland-Altman plot of the relative deviations in ADC values within liver ROIs of an identical volunteer for the seven imaging centers (reference measurement at center F = 0). ADC values calculated centrally are depicted (from left to right: sites C, G, D, A, E, F, B). b Bland-Altman plot of the relative deviations of the gray values for the single-shot T2w within (each liver 3 ROI measurements) of an identical volunteer for the seven imaging centers (reference measurement at center F = 0) (from left to right: sites E, F, C, D, B, A, G)

