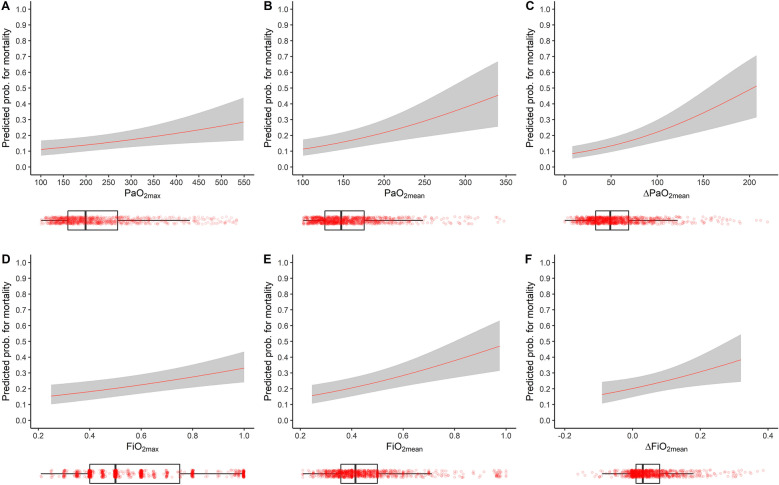
Fig. 2.
The model-based probability for mortality in CENTER-TBI. A–C The probability for mortality estimated by Model 1 (i.e., Table 2) for PaO2max, PaO2mean and ΔPaO2mean vary through the corresponding spanned range of values, respectively, while continuous variables were set to median value and categorical variables to middle category. D–F The probability for mortality estimated by Model 3 (i.e., Table 2) for FiO2max, FiO2mean and ΔFiO2mean vary through the corresponding spanned range of values, respectively. At the same time, continuous variables were set to median value and categorical variables to middle category. Below each panel there are boxplots of the corresponding PaO2 and FiO2 variables, with scattered points of all measurements

