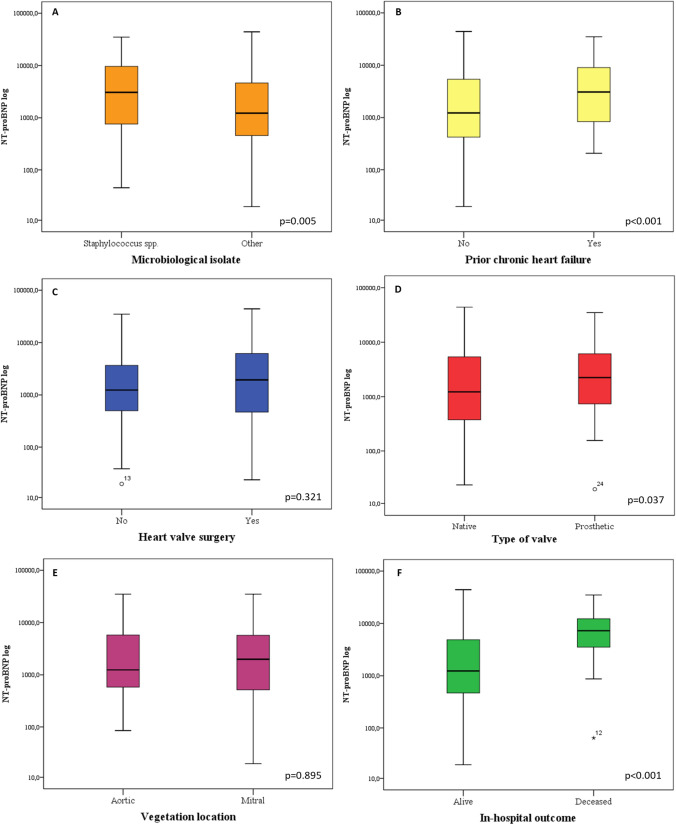
Fig. 1.
NT-proBNP levels in different IE patient subgroups (log-transformed NT-proBNP levels are shown). Each boxplot depicts the NT-proBNP median levels among each subgroup of IE patients. Panel A Microbiological isolates (Staphylococcus spp vs others). Panel B Prior heart failure. Panel C Heart valve surgery. Panel D type of valve (native vs prosthetic). Panel E Vegetation location (aortic vs mitral). Panel F in-hospital outcome (alive vs deceased)

