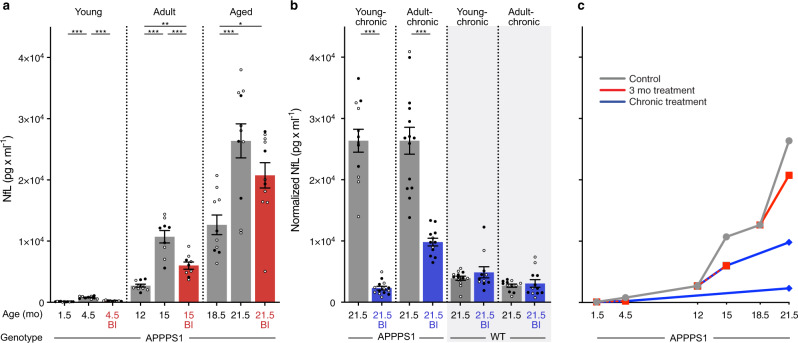
Fig. 4. NfL in CSF after short-term and chronic BACE1 inhibition.
a CSF NfL was measured at baseline and after short-term BI treatment in ‘young’, ‘adult’, and ‘aged’ mice (see Fig. 1 and Supplementary Fig. 1a for treatment groups and number of mice per group; note insufficient CSF amount and/or measurement errors for APPPS1 ‘adult control’, n = 1; ‘aged control’, n = 3; ‘aged BI’, n = 5; ‘young-chronic‘ control, n = 1; young-chronic’ BI, n = 1; and for WT ‘young-chronic’ control, n = 2). BI treatment in the young group prevented the NfL increase, while in the adult and aged groups, NfL still increased compared to baseline levels, albeit less than in the control groups (ANOVA, ‘young’ (F(2, 27) = 80.58; ‘adult’ F(2, 25)= 36.51; ‘aged’ F(2, 29)= 9.254, all P < 0.001; post hoc Tukey’s multiple comparisons, *P < 0.05, **P < 0.01, ***P < 0.001). b CSF NfL in the young-chronic and adult-chronic groups were normalized to the 21.5 mo-old control mice of the 3-month treatment group shown in a. Two-tailed unpaired t tests revealed significantly lower CSF NfL levels in the BI-treated APPPS1 mice (‘young chronic’: t(24) = 13.64; ‘adult-chronic’: t(24) = 6.754, both ***P < 0.001). The same chronic treatment was also undertaken in WT mice (see Fig. 1b for treatment details), but BI treatment had no effect on CSF NfL. c Cross-sectional curve of the group means from a and b shows the slow initial increase of CSF NfL followed by a steep increase of NfL in adult and aged APPPS1 mice (gray line) as predicted by previous studies and shown in Fig. 1a. Although BI treatments in amyloid-laden mice slowed the NfL increase (at least in the adult group), there was still a significant increase compared to the baseline groups. Only when BI treatment was initiated before any amyloid-deposition (i.e., in the young group) could the increase of NfL be blocked. Note the similar NfL levels in chronically treated APPPS1 mice and WT mice at 21.5 months, indicating that the NfL increase in APPPS1 could in fact be completely blocked by the chronic BI treatment. Since the chronic treatments are, in a sense, an extension of the 3-month treatments, the lines are drawn from the 3-month treatments to the end of the chronic treatment. All data are represented as group means ± s.e.m. Open circles are males, filled circles females; no effect of sex was found (see Methods).

