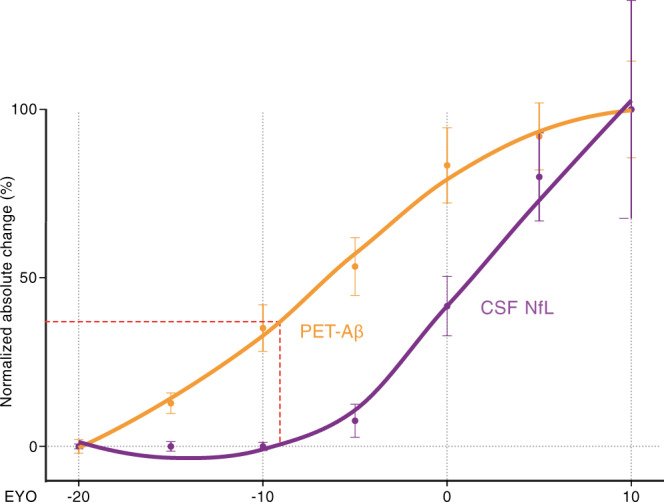
Fig. 5. Trajectories of brain Aβ deposition and CSF NfL in familial Alzheimer´s disease.

Normalized absolute changes (%) in brain Aβ-PET (using Pittsburgh Compound B; orange) and CSF NfL (purple) as a function of the estimated years to clinical symptom onset (EYO). To generate the curves, cross-sectional data from previous Dominantly Inherited Alzheimer’s Network (DIAN) publications were used (for Aβ-PET28; for CSF NfL27). For better comparison of biomarker trajectories between familial AD and the APPPS1 mouse model (see Fig. 1), Aβ-PET and CSF NfL (between EYO −20 and 10) were binned in increments of 5 years (n = 29, 29, 26, 31, 45, and 19 for −20 to −15, −15 to −10, −10 to −5, −5 to 0, 0 to 5, 5 to 10, respectively, for Aβ-PET; n = 8, 15, 13, 18, 17, and 8 for −20 to −15, −15 to −10, −10 to −5, −5 to 0, 0 to 5, 5 to 10, respectively, for CSF NfL). The relative percent change across EYO for each biomarker was calculated, and locally weighted estimated scatter plot smoothing (LOESS) was used for illustrations. Mean ± s.e.m for normalized absolute change of biomarker within each EYO bin are displayed. As in the mouse studies, the increase of CSF NfL in mutation carriers is plotted as the increase over that of non-mutation carriers, i.e., the mean NfL values of non-carrier patients were subtracted from those of the mutation carriers within each EYO bin. Of note, CSF NfL started to increase around EYO −10 when Aβ-PET reached less than half-maximal changes (red dotted line). These curves are based on cross-sectional data; if longitudinal data are used, both curves shift to lower EYO to similar degrees27,70.
