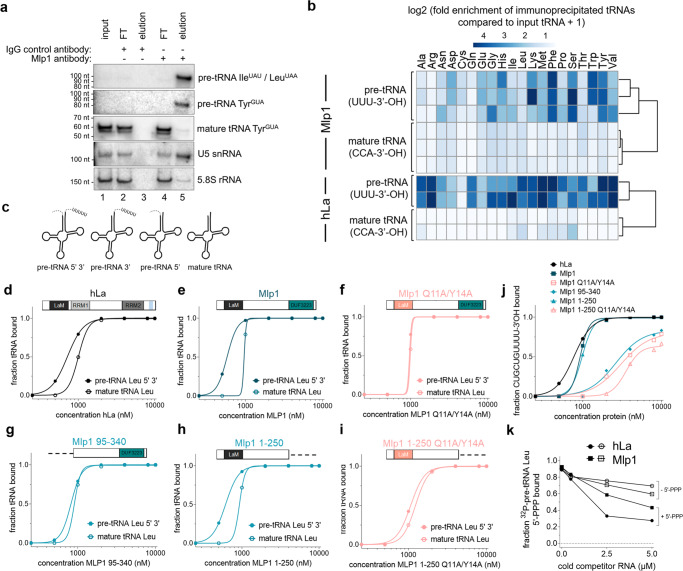
Fig. 2. Mlp1 preferentially binds pre-tRNAs partially via the 3’-terminal uridylates.
a Northern blot analysis of Mlp1 ribonucleoprotein-immunoprecipitated (RIP) samples from T. thermophila. Mlp1 enriches pre-tRNAs more efficiently than mature tRNAs (n = 3 biologically independent samples). Pre-tRNA IleUAU and LeuUAA are both recognized by the 3’-trailer probe used. 5.8S rRNA was used as a non-binding loading control. FT flowthrough, IgG immunoglobin G control antibody. Western blot confirming Mlp1-specific immunoprecipitation is shown in Supplementary Fig. S2a. b Next-generation sequencing data of immunoprecipitated pre-tRNAs (rows represent biologically independent replicates), shown as a heatmap of log2 + 1 transformed fold enrichment calculated by taking ratios of normalized Mlp1-immunoprecipitated tRNA and input tRNA counts per million (CPM) for different tRNA isotypes (top). Next-generation tRNA sequencing data from ref. 22 analyzed similarly for hLa (bottom). The log2 + 1 transformed fold enrichment was calculated by taking ratios of normalized La-immunoprecipitated tRNA and the averaged input tRNAs CPM. The data were split between premature and mature tRNAs based on the 3’-end of the transcript (-CCA-ending mature tRNAs and U-ending pre-tRNAs). Reproducibility between replicates for T. thermophila was determined by correlation plots shown in Supplementary Fig. S3. c Schematic representation of 32P-labeled T. thermophila pre-tRNA intermediates containing 5’-leader and 3’-trailer, 5’-leader only, 3’-trailer only and mature tRNA used in d–i, k, Supplementary Fig. S2d, e, and Fig. 3a, b. d–i Binding curves from EMSAs comparing 32P-labeled LeuAAG 5’-leader, 3’-trailer-containing pre-tRNA and mature LeuAAG tRNA (n ≥ 2 independent experiments). Native gels are shown in Supplementary Fig. S4a and Kd quantification in Table 1. j Binding curves comparing binding of hLa, Mlp1, and Mlp1 mutants to 32P-labeled CUGCUGUUUU-3’OH RNA (n ≥ 2 independent experiments). Native gels are shown in Supplementary Fig. S4a and Kd quantification in Table 1. k Binding curves from competition EMSA between 32P-labeled 5’-leader containing pre-tRNA containing a 5’-triphosphate (+5’PPP) and unlabeled competitors +5’PPP as a positive control and 5’-triphosphate removed pre-tRNA (−5’PPP) (n = 2 independent experiments). Native gels are shown in Supplementary Fig. S4d, e. Source data are provided as a Source Data file.

