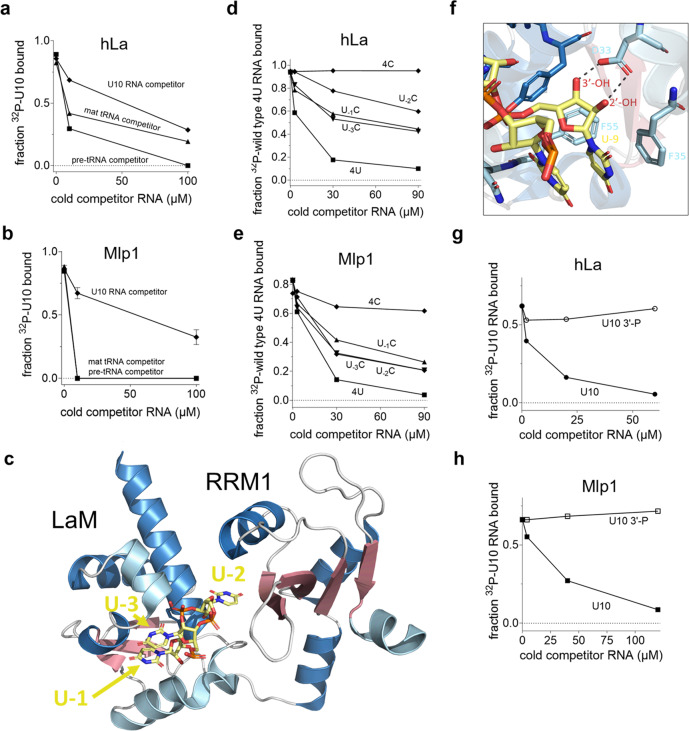
Fig. 3. Mlp1 does not discriminate 3’-uridylates as stringently as hLa.
a, b Binding curves from competition EMSA between 32P-labeled uridylate RNA (U10) and unlabeled competitor U10 RNA (control), 5’-leader and 3’-trailer-containing T. thermophila pre-tRNA LeuAAG and mature tRNA LeuAAG for hLa (a) and Mlp1 (b). Error bars represent the mean +/− standard deviation (Mlp1 U10: n = 4, tRNA: n = 2, hLa U10: n = 2, tRNA: n = 1 independent experiments). Native gels are shown in Supplementary Fig. S5a. c Three-dimensional representation of the hLa protein in complex with uridylate RNA with the last three terminal nucleotides shown (UUU-3’OH) (PDB: 2VOD). The penultimate uridylate U−2 is positioned in between the LaM and RRM1, while the 3’-terminal uridylate U−1 is positioned more towards the outside in stacking formation with U−3. RNA is shown in yellow; β-sheets are shown in red and α-helices shown in blue (dark blue: typical α-helices found in the winged-helix fold and classic RRM, light blue: inserted α-helices specifically found in La proteins). Image generated using PyMOL. d, e Binding curves from competition EMSAs using P32-labeled wild-type CUGCUGUUUU (4U) and unlabeled 4U and mutant RNAs: CUGCUGUUUC (U−1C), CUGCUGUUCU (U−2C), CUGCUGUCUU (U−3C) and CUGCUGCCCC (4 C) for hLa (d) or Mlp1 (e) (n = 2 independent experiments). Native gels are shown in Supplementary Fig. S5c, d. f Magnified views of hLa and 3’-terminal uridylate U−1 interactions (PDB: 2VOD) demonstrating the importance of the 3’-end. Protein carbon backbones have the same color coding as in c, oxygen is shown in red, nitrogen is shown in blue, and phosphorous is shown in orange. RNA is shown in yellow. Image generated using PyMOL. g, h Binding curves from competition EMSA between P32-labeled U10-3’OH and unlabeled U10-3’OH (control) and U10-3’-P for hLa (g) and Mlp1 (h) (n = 2 independent experiments). Native gels are shown in Supplementary Fig. S5e. Source data are provided as a Source Data file.

