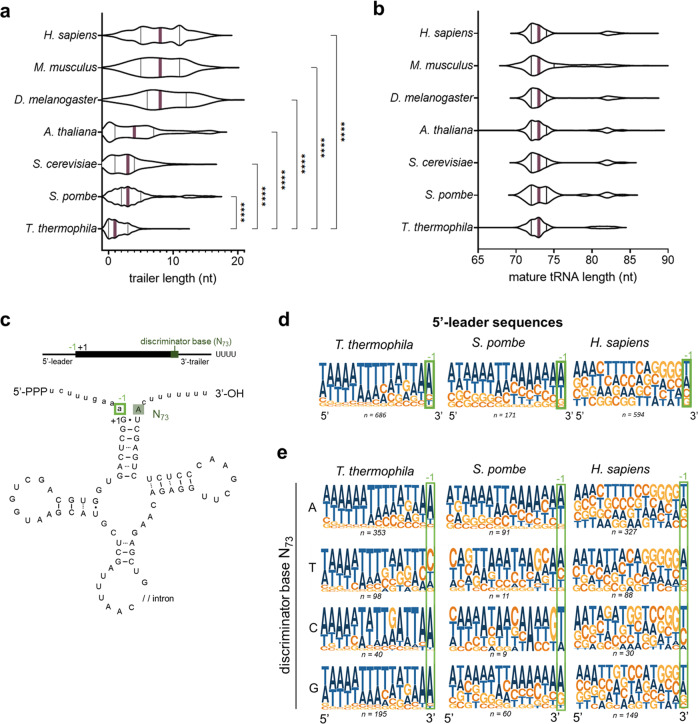
Fig. 6. The 3’-trailer length of T. thermophila tRNAs is considerably shorter compared to other eukaryotes and affects the N−1 composition of the 5’-leader.
a Genome-wide analysis of 3’-trailer lengths as determined by the number of nucleotides between the discriminator base (the most 3’-terminal nucleotide in the mature tRNA upstream of the posttranscriptional added CCA) and a genomic stretch of four Ts of different eukaryotes. Violin plots shows the median as a full purple line and the quartiles as full black lines. A one-way ANOVA with Tukey’s correction for multiple comparisons was performed to determine statistical significance: ****P < 0.0001. Data summary shown in Table 2. b Genome-wide analysis of mature tRNA length for different eukaryotes. Violin plots show the median as a full purple line and the quartiles as full black lines. A one-way ANOVA with Tukey’s correction for multiple comparisons was performed to determine statistical significance: no statistical significance (P < 0.05) was observed. Data summary is shown in Table 2. c Schematic representation of a pre-tRNA. The mature tRNA sequence is shown as a black rectangle and written in uppercase (UCGA) in the tRNA cartoon. Pre-tRNA-specific sequences, including the 5’-leader and 3’-trailer, are shown as a black line and written in lowercase (ucga) in the tRNA cartoon. The discriminator base (N73) is the most 3’-terminal nucleotide of the mature tRNA sequence highlighted in dark green. The most 3’-terminal nucleotide of the 5’-leader sequence is highlighted with a light green box (N−1). d, e Logo analysis of 5’-leader sequences of pre-tRNAs in T. thermophila, S. pombe, and H. sapiens (d). The same analysis split by the discriminator base identity (e). The number of pre-tRNAs representing each condition is shown underneath each logo. Source data are provided as a Source Data file.

