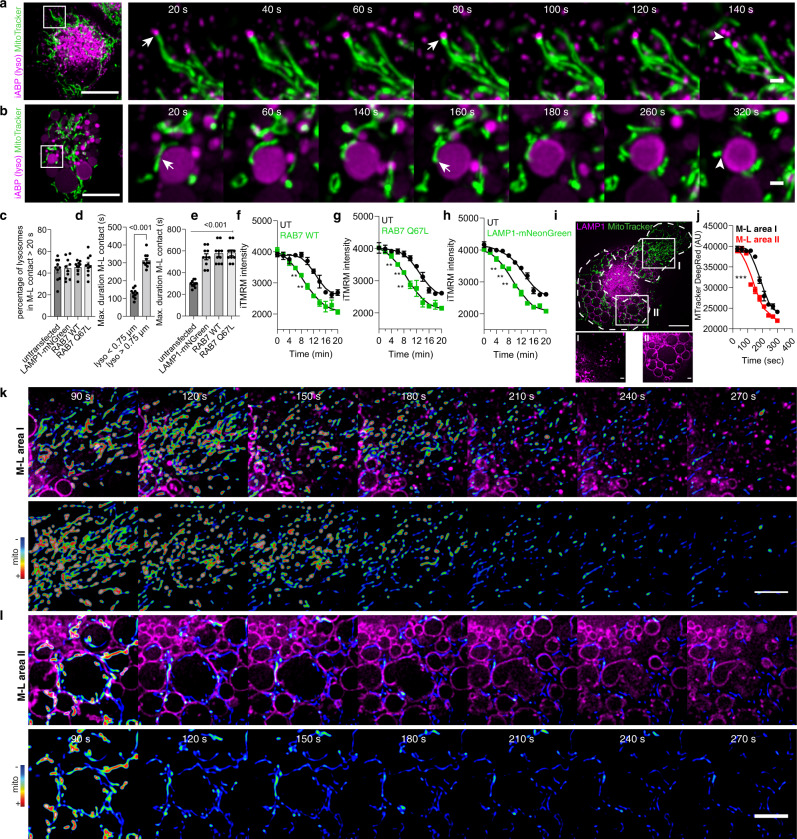
Fig. 4. Proteases leakage from damaged lysosomes in the proximity of mitochondria affects mitochondrial activity.
a, b Live-cell super-resolution imaging (20 s time frame) of iPSDM incubated with MitoTracker Green and with the iABP probe showing sequences following a small (a) and a large (b) lysosome. Scale bars: 10 μm and 1 μm for images and zoom-in, respectively, (see Supplementary Movie 1–2). c–e Quantification from the datasets described above and in Supplementary Fig. 4 showing the percentage of lysosomes in contact with a mitochondrion longer than 20 s (c), the maximum duration of M-L contact in untransfected iPSDM considering lysosomes smaller than 0.75 μm and larger than 0.75 μm (d) or comparing untransfected iPSDM with iPSDM transiently expressing the indicated plasmids (e). Data represent the mean ± SEM of at least 10 cells from one out of three independent experiments. f–h High content single cell evaluation of iTMRM intensity over time comparing untransfected iPSDM with iPSDM transiently expressing RAB7 WT GFP (f), RAB(Q67L) GFP (g) or Lamp1-mNeonGreen (h) after the addition of 0.5 mM of LLOMe. Spline curves are shown, a paired t-test test was used for comparisons. i iPSDM expressing Lamp1-mNeonGreen where the mitochondrial membrane potential evaluation is done in two different M-L areas, where area “I” is characterized by a higher density of small lysosomes in comparison with area “II” as indicated in the bottom panel. Scale bar: 1 μm. j Quantification of MitoTracker Deep Red intensity after LLOMe treatment in the indicated M-L areas. k, l A time-lapse sequence belonging to M-L area “I” and “II”, respectively. The mitochondrial signal is shown as RGB rainbow scale, (see Supplementary Movie 3–5). **p ≤ 0.01; ***p ≤ 0.001. Bar plots represent mean values +/− SEM of at least three independent experiments. Scale bars: 10 μm and 5 μm for images and zoom-in, respectively. Source data are provided as a Source Data file.

